Research Article | Volume 3 - Issue 2 | Article DOI :
Download PDF
Amran Al Kamzari1*, Sulaiman Al Shehhi1, Mohammed Al Kalbani1 and Tim Gray2
1Environment Authority, Ministries Street - Al-Khuwair, Sultanate of Oman
2Newcastle University, School of Geography, UK
Corresponding Author:
Amran Al Kamzari, Environment Authority, Ministries Street - Al-Khuwair, PO Box: 323 Postal Code: 100, Muscat, Sultanate of Oman.
Abstract
This study investigates heavy metal contamination in seawater and sediments in three coastal regions of Oman – Darsait, Azaibah and Seeb. In 2022, sample collections were made in subtidal ecosystems in these three areas, and the samples were analysed to assess the potential environmental impacts of treated wastewater. The study employed a comprehensive sampling strategy adhering to the Oman Environmental Impact Assessment (EIA) Guidelines to evaluate key parameters such as temperature, salinity, dissolved oxygen, and heavy metal concentrations see Appendix 1. Results indicate that the levels of most heavy metals contamination had not changed significantly since the baseline surveys in 2009 and 2012, but that some levels were still above EIA guidelines. Recommendations are made to reduce these levels, ensuring the protection of marine environments and humans while supporting industrial growth. This research contributes to our understanding of anthropogenic impacts on marine ecosystems in Oman and highlights the importance of regular monitoring and adaptive management practices.
Comparison between the three sites’ results in 2009/2012 and 2022
The following results compare data from 2009/2012 with data from 2022 on seawater and sediment quality at the Darsait, Azaibah, and Seeb plants, respectively.
Seawater Samples:
There are no seawater samples for 2009/2012 available for Darsait or Asaibah, so a comparative analysis is only possible for Seeb data – between 2009 and 2022.
Darsait:
[This section refers only to 2022 data, so there is no comparison with 2012 data. Figure 8 has comparative data only for SW5. Figure 10 has comparative data only for copper and zinc].
In 2022, heavy metal concentrations in Darsait seawater samples largely fell within UK EQS limits. For arsenic, cadmium, chromium, and lead, the concentrations were below the detection limit (<0.01 Mg/kg), which is well below the UK EQS limits of 0.025, 0.0025, 0.015, and 0.025 respectively. Copper was registered at 0.02 Mg/kg, while zinc was at 0.03 Mg/kg, compared to UK EQS limits of 0.005 and 0.04 respectively. Mercury was also below the detection limit (<0.001), with a UK EQS limit of 0.0003. Nickel was below the detection limit (<0.01 Mg/kg), lower than the UK EQS limit of 0.03 (see Table 8 and Figure 10) There was missing data for heavy metal concentrations in Darsait seawater samples in 2012.
Table 8: Comparative analysis of Darsait’s seawater quality between 2012 and 2022 [27-38].
|
Parameters
|
Unit
|
Test/ Method
|
MDL
|
Sample locations
|
UK EQS
Limit
|
|
SW1
|
SW2
|
SW3
|
SW4
|
SW5
|
|
2022
|
2012
|
%
Different
|
2022
|
2012
|
%
Different
|
2022
|
2012
|
%
Different
|
2022
|
2012
|
%
Different
|
2022
|
2012
|
%
Different
|
|
Arsenic
|
Mg/kg
|
APHA 3120
B
|
0.01
|
<0.01
|
-
|
-
|
<0.01
|
-
|
-
|
<0.01
|
-
|
-
|
<0.01
|
-
|
-
|
<0.01
|
<0.01
|
-
|
0.025
|
|
Cadmium
|
0.003
|
<0.01
|
-
|
-
|
<0.01
|
-
|
-
|
<0.01
|
-
|
-
|
<0.01
|
-
|
-
|
<0.01
|
<0.01
|
-
|
0.0025
|
|
Chromium
|
0.02
|
<0.01
|
-
|
-
|
<0.01
|
-
|
-
|
<0.01
|
-
|
-
|
<0.01
|
-
|
-
|
<0.01
|
<0.01
|
-
|
0.015
|
|
Copper
|
0.02
|
0.01
|
-
|
-
|
0.02
|
-
|
-
|
0.01
|
-
|
-
|
0.01
|
-
|
-
|
0.02
|
0.02
|
-
|
0.005
|
|
Lead
|
0.01
|
<0.01
|
-
|
-
|
<0.01
|
-
|
-
|
<0.01
|
-
|
-
|
<0.01
|
-
|
-
|
<0.01
|
<0.01
|
-
|
0.025
|
|
Zinc
|
0.1
|
0.02
|
-
|
-
|
0.02
|
-
|
-
|
0.03
|
-
|
-
|
0.02
|
-
|
-
|
0.03
|
0.03
|
-
|
0.04
|
|
Mercury
|
|
<0.001
|
-
|
-
|
<0.001
|
-
|
-
|
<0.001
|
-
|
-
|
<0.001
|
-
|
-
|
<0.001
|
<0.001
|
-
|
0.0003
|
|
Nickel
|
0.02
|
<0.01
|
-
|
-
|
<0.01
|
-
|
-
|
<0.01
|
-
|
-
|
<0.01
|
-
|
-
|
<0.01
|
<0.01
|
-
|
0.03
|
|
Vanadium
|
|
<0.01
|
-
|
-
|
<0.01
|
-
|
-
|
<0.01
|
-
|
-
|
<0.01
|
-
|
-
|
<0.01
|
<0.01
|
-
|
0.1
|
|
Silver
|
|
<0.01
|
-
|
-
|
<0.01
|
-
|
-
|
<0.01
|
-
|
-
|
<0.01
|
-
|
-
|
<0.01
|
<0.01
|
/
|
0.0005
|
|
Barium
|
0.1
|
<0.01
|
-
|
-
|
<0.01
|
-
|
-
|
<0.01
|
-
|
-
|
<0.01
|
-
|
-
|
<0.01
|
<0.01
|
/
|
-
|
|
Selenium
|
|
<0.01
|
-
|
-
|
<0.01
|
-
|
-
|
<0.01
|
-
|
-
|
<0.01
|
-
|
-
|
<0.01
|
<0.01
|
/
|
-
|
|
Strontium
|
|
9.99
|
-
|
-
|
9.44
|
-
|
-
|
9.58
|
-
|
-
|
9.62
|
-
|
-
|
1.1
|
9.08
|
-
|
0.01
|
|
Tin
|
|
<0.01
|
-
|
-
|
<0.01
|
-
|
-
|
<0.01
|
-
|
-
|
<0.01
|
-
|
-
|
1.1
|
<0.01
|
|
0.01
|

Figure 10: Graphical representation of the comparative analysis of Darsait’s seawater quality between 2012 and 2022 (Source: the lead author)
Azaibah:
[This section is redundant because no comparison is possible between 2022 data and earlier data since there is no data for 2009/2012] No testing for heavy metals was conducted on seawater samples from the Azaibah area before the present study, so there is no comparative data [This section is redundant because no comparison is possible between 2022 data and earlier data since there is no data for 2009/2012] No testing for heavy metals was conducted on seawater samples from the Azaibah area before the present study, so there is no comparative data
Seeb :
[This section is the only one where a genuine comparative analysis is presented]
The comparison of metal levels between 2009 and 2022 at Seeb reveals several notable trends. Arsenic levels remained below 0.01 Mg/ kg in 2009 and increased slightly, ranging from 0.006 to 0.0111 Mg/ kg in 2022, but they still stay below the Uk EQS Limit of 0.025 Mg/kg. Cadmium levels decreased from below 0.01 Mg/kg in 2009 to between 0.0001 and 0.0004 Mg/kg in 2022. Chromium also saw a slight increase, from below 0.01 Mg/kg to around 0.0012–0.0015 Mg/kg, remaining well below the 0.02 Mg/kg Uk EQS Limit. Copper experienced a significant decrease, from 0.04 Mg/kg in 2009 to between 0.0017 and 0.0051 Mg/kg in 2022. Lead levels dropped from below 0.01 Mg/kg to less than 0.00016 Mg/kg, indicating an improvement in this parameter. Zinc levels slightly decreased from 0.02 Mg/kg in 2009 to approximately 0.0191–0.0194 Mg/kg in 2022, both well below the Uk EQS Limit of 0.1 Mg/kg. Mercury levels also declined, from less than 0.001 Mg/kg to below 0.0003 Mg/kg. Nickel showed a modest decrease, from 0.02 Mg/kg to below 0.01 Mg/ kg. Vanadium levels remained below detection levels in both years. Silver levels stayed stable at below 0.01 Mg/kg. Barium, which was at 0.1 Mg/ kg in 2009, decreased significantly to levels between 0.0024 and 0.0038 Mg/kg in 2022. Selenium levels remained below 0.01 Mg/kg across both years. Strontium, however, increased from 8.04 Mg/kg in 2009 to around 10.2–10.8 Mg/kg in 2022. Tin levels remained stable at below 0.01 Mg/ kg. Overall, most metal concentrations have either decreased or remained stable over time, indicating an overall improvement or consistent water quality at Seeb (see Table 9 and Figure 11).
Table 9: Comparative analysis of Seeb’s seawater quality between 2009 and 2022 (Comparative Summary of Seawater Quality: Baseline versus 2022 [40-42].
|
Parameters
|
Unit
|
Test/ Method
|
MDL
|
Sample locations
|
UK EQS
Limit
|
|
SW1
|
SW2
|
SW3
|
SW4
|
SW5
|
|
2022
|
2009
|
%
Different
|
2022
|
2009
|
%
Different
|
2022
|
2009
|
%
Different
|
2022
|
2009
|
%
Different
|
2022
|
2009
|
%
Different
|
|
Arsenic
|
Mg/kg
|
APHA 3120 B
|
0.01
|
<0.01
|
0.00342
|
-
|
<0.01
|
0.00603
|
-
|
<0.01
|
0.00631
|
-
|
<0.01
|
0.00841
|
-
|
<0.01
|
0.0111
|
-
|
0.025
|
|
Cadmium
|
0.003
|
<0.01
|
0.00412
|
-
|
<0.01
|
0.000212
|
-
|
<0.01
|
0.000421
|
-
|
<0.01
|
<0.00012
|
-
|
<0.01
|
0.000132
|
-
|
0.0025
|
|
Chromium
|
0.02
|
<0.01
|
0.000545
|
-
|
<0.01
|
0.000891
|
-
|
<0.01
|
0.0014
|
-
|
<0.01
|
0.00124
|
-
|
<0.01
|
0.0015
|
-
|
0.015
|
|
Copper
|
0.02
|
0.04
|
<0.0009
|
-
|
0.03
|
0.00925
|
224.3
|
0.04
|
<0.0009
|
-
|
0.02
|
0.00176
|
1036.4
|
0.03
|
0.00515
|
482.5
|
0.005
|
|
Lead
|
0.01
|
<0.01
|
<0.00016
|
-
|
<0.01
|
0.000998
|
-
|
<0.01
|
<0.00016
|
-
|
<0.01
|
<0.00016
|
-
|
<0.01
|
<0.00016
|
-
|
0.025
|
|
Zinc
|
0.1
|
0.02
|
0.282
|
-92.9
|
0.03
|
0.127
|
-76.4
|
0.06
|
0.023
|
160.9
|
0.04
|
<0.00327
|
-
|
0.02
|
0.0191
|
4.7
|
0.04
|
|
Mercury
|
|
<0.001
|
<0.00005
|
-
|
<0.001
|
<0.00005
|
-
|
<0.001
|
<0.00005
|
-
|
<0.001
|
<0.00005
|
-
|
<0.001
|
<0.00005
|
-
|
0.0003
|
|
Nickel
|
0.02
|
<0.01
|
0.0053
|
-
|
<0.01
|
0.00668
|
-
|
<0.01
|
0.00661
|
-
|
<0.01
|
0.00713
|
-
|
<0.01
|
0.00934
|
-
|
0.03
|
|
Vanadium
|
|
|
|
-
|
<0.01
|
-
|
-
|
<0.01
|
-
|
-
|
<0.01
|
-
|
-
|
<0.01
|
|
-
|
0.1
|
|
Silver
|
|
<0.01
|
|
-
|
<0.01
|
-
|
-
|
<0.01
|
-
|
-
|
<0.01
|
-
|
-
|
<0.01
|
|
/
|
0.0005
|
|
Barium
|
0.1
|
<0.01
|
0.036
|
-
|
<0.01
|
0.00313
|
-
|
<0.01
|
0.00241
|
-
|
<0.01
|
0.00358
|
-
|
<0.01
|
0.00421
|
/
|
-
|
|
Selenium
|
|
<0.01
|
|
-
|
<0.01
|
-
|
-
|
<0.01
|
-
|
-
|
<0.01
|
-
|
-
|
<0.01
|
|
/
|
-
|
|
Strontium
|
|
7.13
|
-
|
-
|
8.04
|
-
|
-
|
10.2
|
-
|
-
|
10.6
|
-
|
-
|
10.8
|
|
-
|
0.01
|
|
Tin
|
|
<0.01
|
-
|
-
|
<0.01
|
-
|
-
|
<0.01
|
-
|
-
|
<0.01
|
-
|
-
|
<0.01
|
|
|
0.01
|

Figure 11: Graphical representation of the comparative analysis of Seeb’s seawater quality between 2009 and 2022 (Source: the lead author)
Sediment Samples: From sediment samples across the three sites— Darsait, Azaibah, and Seeb—the following trends between 2009/2012 and 2022 were observed:
In the Darsait area, a comparison of sediment samples between 2022 and 2012 reveals several changes in heavy metal concentrations. The arsenic concentrations in seawater samples from locations SD1 to SD5 were below the detection limit (<10 µg/L) in 2012. By 2022, statistically significant reductions were observed across all sampling sites, with arsenic levels recorded as follows: SD1 at 1.4 µg/L, SD2 at 0.8 µg/L, SD3 at 1.1 µg/L, SD4 at 1.4 µg/L, and SD5 at 0.4 µg/L. These results indicate a notable decline in arsenic levels over the ten-year period, suggesting improved water quality or reduced arsenic sources in these locations. The cadmium concentrations in the water samples collected from sites SD1 to SD5 exhibited levels below the detection limit (<10 µg/L) in 2012. By 2022, cadmium levels across all sites had declined significantly, with concentrations recorded as <0.1 µg/L at each location. This consistent decrease over the ten-year interval indicates a substantial improvement in water quality concerning cadmium contamination, likely reflecting effective environmental management or reduced anthropogenic sources of cadmium input in the studied area. Lead remained below detection limits. The temporal comparison of copper concentrations across the five sampling stations (SD1–SD5) between 2012 and 2022 reveals spatially variable trends. At SD1, copper levels exhibited a slight decline from 5.53 µg/L in 2012 to 5.10 µg/L in 2022, indicating relative stability. In contrast, SD2 showed a marked increase, rising from 3.96 µg/L in 2012 to 9.30 µg/L in 2022, suggesting potential localized inputs or changes in hydrodynamic conditions. Similarly, SD3 displayed more than a two fold increase, from 3.00 µg/L to 6.80 µg/L over the same period. At SD4, concentrations remained comparatively stable, with only a modest increase from 4.08 µg/L in 2012 to 5.10 µg/L in 2022. Finally, SD5 recorded a moderate increase, rising from 3.98 µg/L in 2012 to 5.80 µg/L in 2022. Overall, while some stations (SD1, SD4) maintained near-constant levels, others (particularly SD2 and SD3) experienced substantial increases, which may reflect differential anthropogenic pressures or site-specific environmental processes. The analysis of copper concentrations across all sampling stations (SD1–SD5) in both 2012 and 2022 demonstrated consistently low levels, with values remaining below the detection limit (<1 µg/L) throughout the study period. No temporal or spatial variation was observed, indicating that copper contamination was negligible or absent in the surveyed sites over the ten-year interval. This stability suggests that either anthropogenic inputs of copper were minimal, or that effective natural attenuation and dilution processes prevailed in the study area. Mercury was detected in 2012 and 2022 at low levels. Zinc remained stable across the sampling locations. Chromium concentrations decreased significantly at SD2 from 75.9 to 34.1 Mg/kg, at SD3 from 68.8 to 30.7 Mg/kg and at SD1 from 70.6 to 35 Mg/kg. Nickel levels also decreased across all sampling locations. For example, nickel decreased at SD1 from 228.2 to 124 Mg/kg; at SD2 from 229.6 to 130 Mg/kg; and at SD3 from 224.1 to 109Mg/kg (See Table 10 and Figure 12).
Table 10: Comparative summary of findings in 2012 and 2022 from sediment samples in Darsait. [29-38].
|
Parameter
|
Unit
|
Test
|
Sample locations
|
|
Method
|
SD1
|
SD2
|
SD3
|
SD4
|
SD5
|
|
Mg/kg
|
USEPA
SW846/6010
|
2022
|
2012
|
%
difference
|
2022
|
2012
|
%
difference
|
2022
|
2012
|
%
difference
|
2022
|
2012
|
%
difference
|
2022
|
2012
|
%
difference
|
|
Arsenic
|
<10
|
1.4
|
|
<10
|
0.8
|
|
<10
|
1.1
|
|
<10
|
1.4
|
|
<10
|
0.4
|
|
|
Cadmium
|
<1
|
<0.1
|
|
<1
|
<0.1
|
|
<1
|
<0.1
|
|
<1
|
<0.1
|
|
<1
|
<0.1
|
|
|
Chromium
|
35
|
70.6
|
-50.4
|
34.1
|
75.9
|
-55.1
|
30.7
|
68.8
|
-55.4
|
33.8
|
70.6
|
|
34.9
|
72.3
|
-51.7
|
|
copper
|
5.53
|
5.1
|
8.4
|
3.96
|
9.3
|
-57.4
|
3
|
6.8
|
-55.9
|
4.08
|
5.1
|
|
3.98
|
5.8
|
-31.4
|
|
Selenium
|
<10
|
|
|
<10
|
|
|
<10
|
|
|
<10
|
|
|
<10
|
|
|
|
Lead
|
<1
|
<1
|
|
<1
|
<1
|
|
<1
|
<1
|
|
<1
|
<1
|
|
<1
|
<1
|
|
|
Mercury
|
<0.1
|
<0.01
|
|
<0.1
|
<0.01
|
|
<0.1
|
<0.01
|
|
<0.1
|
<0.01
|
|
<0.1
|
<0.01
|
|
|
Barium
|
1.84
|
|
|
1.08
|
|
|
1
|
|
|
1.3
|
|
|
1.99
|
|
|
|
Nickel
|
124
|
228.2
|
-45.7
|
130
|
229.6
|
-43.4
|
109
|
224.1
|
-51.4
|
129
|
228.2
|
|
133
|
236.3
|
-43.7
|
|
Vanadium
|
<10
|
7.1
|
|
<10
|
8.5
|
|
<10
|
5.3
|
|
|
7.1
|
|
|
6.9
|
|
|
Zinc
|
14.7
|
|
|
8.42
|
|
|
6.71
|
|
|
7.94
|
|
|
9.96
|
|
|
|
Silver
|
<1
|
|
|
<1
|
|
|
<1
|
|
|
<1
|
|
|
<1
|
|
|
|
Strontium
|
464
|
|
|
498
|
|
|
766
|
|
|
585
|
|
|
567
|
|
|
|
Tin
|
HACH
|
<10
|
|
|
<10
|
|
|
<10
|
|
|
<10
|
|
|
<10
|
|
|

Figure 12: Graphical representation of the comparative analysis of 2012 and 2022 data from sediment samples in Darsait. (Source: the lead author).
In the Azaibah area, sediment analysis in 2022, when compared to 2012, revealed the following trends in heavy metal concentrations: Arsenic concentrations remained low with no significant change, and cadmium was consistently below detection limits. Chromium levels demonstrated a notable decrease at SD2. A major rise was observed for copper at SD1. Lead consistently remained below detection limits, and mercury was detected only in 2012 at very low levels, with no current findings. Nickel exhibited a significant increase at SD3. Zinc levels remained stable. (See Table 11 and Figure 13).
|
Parameter
|
Unit
|
Test
|
Sample locations
|
|
Method
|
SD1
|
SD2
|
SD3
|
SD4
|
SD5
|
|
Mg/kg
|
USEPA
SW846/6010
|
2022
|
2012
|
%
difference
|
2022
|
2012
|
%
difference
|
2022
|
2012
|
%
difference
|
2022
|
2012
|
%
difference
|
2022
|
2012
|
%
difference
|
|
Arsenic
|
<10
|
2.811
|
|
<10
|
1.686
|
|
<10
|
2.292
|
|
<10
|
2.811
|
|
<10
|
2.929
|
|
|
Cadmium
|
<1
|
<0.1
|
|
<1
|
<0.1
|
|
<1
|
<1
|
|
<1
|
<0.1
|
|
<1
|
<0.1
|
|
|
Chromium
|
28.1
|
60.48
|
-53.5
|
22.7
|
55.85
|
-59.4
|
19.6
|
45.78
|
-57.2
|
30.2
|
65.09
|
|
35
|
50.69
|
-31.0
|
|
copper
|
1.65
|
2.261
|
-27.0
|
1.86
|
1.553
|
19.8
|
2.79
|
0.848
|
229.0
|
2.07
|
0.868
|
|
1.94
|
3.369
|
-42.4
|
|
Selenium
|
<10
|
|
|
<10
|
|
|
<10
|
|
|
<10
|
|
|
<10
|
|
|
|
Lead
|
<1
|
<1
|
|
<1
|
<1
|
|
<1
|
<1
|
|
<1
|
<1
|
|
<1
|
<1
|
|
|
Mercury
|
<0.1
|
<0.01
|
|
<0.1
|
<0.01
|
|
<0.1
|
<0.01
|
|
<0.1
|
<0.01
|
|
<0.1
|
<0.01
|
|
|
Barium
|
4.96
|
|
|
4.05
|
|
|
4.9
|
|
|
2.48
|
|
|
1.94
|
|
|
|
Nickel
|
108
|
184
|
-41.3
|
84.6
|
165.8
|
-49.0
|
108
|
126.5
|
-14.6
|
119
|
159.6
|
|
125
|
145.7
|
-14.2
|
|
Vanadium
|
<10
|
18.1
|
|
<10
|
14.25
|
|
<10
|
9.269
|
|
<10
|
24.78
|
|
<10
|
6.598
|
|
|
Zinc
|
4.55
|
7.687
|
-40.8
|
4.36
|
7.843
|
-44.4
|
4.89
|
7.608
|
-35.7
|
4.48
|
7.607
|
-41.1
|
4.5
|
10.53
|
-57.3
|
|
Silver
|
<1
|
|
|
<1
|
|
|
<1
|
|
|
<1
|
|
|
<1
|
|
|
|
Strontium
|
726
|
|
|
798
|
|
|
897
|
|
|
870
|
|
|
722
|
|
|
|
Tin
|
HACH
|
<10
|
|
|
<10
|
|
|
<10
|
|
|
<10
|
|
|
<10
|
|
|

Figure 13: Graphical representation of the comparative analysis of 2012 and 2022 data from sediment samples in Azaibah (Source: the lead author).
In the Seeb area, the analysis of sediment samples reveals a notable improvement in sediment quality between 2009 and 2022. In 2022, arsenic and lead were below detection limits, while cadmium remained consistently below 1 mg/kg, and mercury levels were very low. Significant reductions were observed in chromium and copper concentrations. Specifically, chromium decreased by 82.8% to 88.5% across different sample locations, while copper decreased by 37% to 84.8%. Barium, nickel, and zinc levels also showed substantial decreases, with zinc showing the most significant reduction, up to 95.5%. The specific values for 2009 and 2022, along with the percentage differences, are detailed in Table 12 and graphically represented in Figure 14.
Table 12: Comparative summary of findings from sediment samples in Seeb in 2009 and 2022 [40-42].
|
Parameter
|
Unit
|
Test
|
Sample locations
|
|
Method
|
SD1
|
SD2
|
SD3
|
SD4
|
SD5
|
|
Mg/ kg
|
USEPA SW846/ 6010
|
2022
|
2009
|
%
difference
|
2022
|
2009
|
%
difference
|
2022
|
2009
|
%
difference
|
2022
|
2009
|
%
difference
|
2022
|
2009
|
%
difference
|
|
Arsenic
|
<10
|
10.1
|
|
<10
|
9.48
|
|
<10
|
16.7
|
|
<10
|
19.2
|
|
<10
|
10.6
|
|
|
Cadmium
|
<1
|
0.217
|
|
<1
|
0.164
|
|
<1
|
0.164
|
|
<1
|
0.163
|
|
<1
|
0.193
|
|
|
Chromium
|
31.7
|
184
|
-82.8
|
28
|
137
|
-79.6
|
30.7
|
237
|
-87
|
26.1
|
226
|
-88.5
|
20.4
|
120
|
-83
|
|
copper
|
3.96
|
8.93
|
-55.7
|
2.66
|
9.86
|
-37
|
1.86
|
8.7
|
-78.6
|
2.02
|
13.3
|
-84.8
|
1.94
|
7.8
|
-75.1
|
|
Selenium
|
<10
|
|
|
<10
|
|
|
<10
|
|
|
<10
|
|
|
<10
|
|
|
|
Lead
|
<1
|
4.43
|
|
<1
|
3.99
|
|
<1
|
2.76
|
|
<1
|
2.61
|
|
<1
|
4.41
|
|
|
Mercury
|
<0.1
|
<0.006
|
|
<0.1
|
<0.006
|
|
<0.1
|
<.006
|
|
<0.1
|
<0.006
|
|
<0.1
|
<0.006
|
|
|
Barium
|
1.98
|
13.4
|
-85.2
|
2.5
|
11.2
|
-77.7
|
1.86
|
34.3
|
-94.6
|
3.1
|
30.4
|
-89.8
|
4.85
|
15.7
|
-69.1
|
|
Nickel
|
138.5
|
418
|
-66.9
|
110.4
|
451
|
-75.5
|
125
|
608
|
-79.4
|
89
|
685
|
-87
|
71.7
|
392
|
-81.7
|
|
Vanadium
|
<10
|
|
|
<10
|
|
|
<10
|
|
|
<10
|
|
|
<10
|
|
|
|
Zinc
|
2.97
|
66.3
|
-95.5
|
2.57
|
33.3
|
-92.3
|
2.79
|
24.6
|
-88.7
|
2.1
|
34
|
-93.8
|
1.94
|
21.6
|
-91
|
|
Silver
|
<1
|
|
|
<1
|
|
|
<1
|
|
|
<1
|
|
|
<1
|
|
|
|
Strontium
|
460.9
|
|
|
496.2
|
|
|
638.7
|
|
|
628
|
|
|
640.5
|
|
|
|
Tin
|
HACH
|
<10
|
|
|
<10
|
|
|
<10
|
|
|
<10
|
|
|
<10
|
|
|

Figure 14: Graphical representation of the comparative analysis of 2009 and 2022 data from sediment samples in Seeb (Source: the lead author).
REFERENCES
- Yu R, Yuan X, Zhao Y, Hu G, Tu X. Heavy metal pollution in intertidal sediments from Quanzhou Bay, China. J Environ Sci. 2008; 20: 664- 669.
- DeForest DK, Brix KV, Adams WJ. Assessing metal bioaccumulation in aquatic environments: The inverse relationship between bioaccumulation factors,trophic transfer factors and exposure concentration. Aquat. Toxicol. 2007; 84: 236-246.
- Hosono T, Su C, Delinom R, Umezawa Y, Toyota T, Kaneko S, et al. Decline in heavy metal contamination in marine sediments in Jakarta Bay, Indonesia due to increasing environmental regulations. Estuar. Coast. Shelf Sci. 2011; 92: 297-306.
- Fu F, Wang Q. Removal of heavy metal ions from wastewaters: areview. J Environ Manage. 2011; 92: 407-418.
- Akpor OB, Ohiobor GO, Olaolu DT. Heavy metal pollutants in wastewater effluents: sources, effects and remediation. Adv in Biosci and Bioengin. 2014; 2: 37-43.
- Al-Hatrushi S, Kwarteng A, McLachlan A, Sana A, Al-Buloshi A, Hamed K, et al. A preliminary assessment of coastal erosion along the Batinah: Sultanate of Oman. Oman: Sultan Qaboos University College of Arts. 2005.
- Van Lavieren H, Burt JA, Feary DA, Cavalcante GH, Marquis E, Benedetti L, et al. Managing the growing impacts of development on fragile coastal and marine ecosystems: Lessons from the Gulf. United Nations University. 2012.
- Sheppard C, Al-Husiani M, Al-Jamali F, Al-Yamani F, Baldwin R, Bishop J, et al. The Gulf: A young sea in decline. Mar. Pollut. Bull. 2010; 60: 3-38.
- Uddin S, Gevao B, Al-Ghadban AN, Nithyanandan M, Al-Shamroukh D. Acidification in the Arabian Gulf: I Insights from pH and temperature measurements. J Environ Monit. 2012; 14: 1479-1482.
- Price A, Sheppard C, Roberts C. The Gulf: Its biological setting. Mar Pollut Bull. 1993; 27: 9-15.
- Naser HA. Human impacts on marine biodiversity: Macrobenthos in Bahrain, Arabian Gulf. In: Lopez-Pujol, J. (Ed.), The Importance of Biological Interactions in the Study of Biodiversity. 2011: 109-126.
- Carpenter K, Krupp F, Jones D, Zajonz U. The Living Marine Resources of Kuwait, Eastern Saudi Arabia, Bahrain, Qatar and the United Arab Emirates: FAO Species Identification Field Guide for Fishery Purposes. Food and Agriculture Organization of the United Nations. Rome. 1997; 293: 17.
- Mateos-Molina D, Pittman SJ, Antonopoulou M, Carpenter S, Möller M, Muzaffar SB, et al. Coastal lagoons (Khors) of the emirates. In [add editor] A Natural History of the Emirates. 2023: 241-265.
- Vaughan GO, Al-Mansoori N, Burt JA. The Arabian Gulf. In WorldSeas: An Environmental Evaluation. 2019: 1-23.
- Halpern BS, Walbridge S, Selkoe KA, Kappel CV, Micheli F, D’Agrosa C, et al. A global map of human impact on marine ecosystems. Science. 2008; 319: 948-952.
- Naser HA. Metal concentrations in marine sediments influenced by an thropogenic activities in Bahrain, Arabian Gulf. In: Hong-Bo, Shao (Ed.), Metal Contaminations: Sources, Detection and Environmental Impacts. 2012: 157-175.
- Sheppard C, Price A, Roberts C. Marine Ecology of the Arabian Region: Patterns and Processes in Extreme Tropical Environments. Academic Press. 1992.
- Abuzinada AH, Barth HJ, Krupp F, Böer B, Al Abdessalaam TZ. Protecting the Gulf’s Marine Ecosystems from Pollution. Springer Science & Business Media. 2008.
- Singh K, Mohan D, Sinha S, Dalwani R. Impact assessment of treated/ untreated wastewater toxicants discharged by sewage treatment plants on health, agricultural, and environmental quality in wastewater disposal area. Chemosphere. 2004; 55: 227-255.
- Chitrakar P, Baawain MS, Sana A, Al-Mamun A. Multivariate statistical technique in the assessment of coastal water quality of Oman. J of Environ Engin and Sci. 2020; 15: 141-153.
- Bashitialshaaer R Desalination and brine discharge case study forPEAW in Oman. J of Water Management and Res. 2016; 72: 41-47.
- Al Muzaini M, Mendonca VM, Al Sariri T, Al Jabri M. Wastewater discharge into the marine environment in the Sultanate of Oman: sources and standards – an overview of the current situation. In Proceedings of the 3rd International Conference on Marine WasteWater Disposal and Marine Environment. 2004; 3: 1-8.
- Ahmed M, Shayya WH, Hoey D, Al-Handaly J. Brine disposal from reverse osmosis desalination plants in Oman and the United Arab Emirates. Desalination. 2001; 133: 135-147.
- Al-Muzaini S, Beg M, Muslamani K, Al-Mutairi M. The quality of marine water around a sewage outfall. Water Sci Technol. 1999; 40: 11-15.
- Shatti J, Abdullah T. Marine pollution due to wastewater discharge in Kuwait. Water Sci Technol. 1999; 40: 33-39.
- Naser HA. Assessment and management of heavy metal pollution in the marine environment of the Arabian Gulf: A review. Mar Pollut Bull. 2013; 72: 6-13.
- Baawain M, Sana A, Al-Yahyai R, Amoatey P. Sustainable reuse options of treated effluents: A case study from Muscat, Oman. J of Environ Engin and Sci. 2019; 14: 195-202.
- Baawain MS, Al-Omairi A, Choudri BS. Characterization of domestic wastewater treatment in Oman from three different regions and current implications of treated effluents. Environ Monit and Assess. 2014; 186: 2701-2716.
- Five Oceans. “Darsit STP Emergency Outfall Environment Impact Assessment”. EIA Report. 2012a: 581.
- Five Oceans. “Azaibah CPS Emergency Outfall Environmental Impact Assessment”. EIA Report. 2012b: 408.
- Simpson SL, Batley GE, Chariton AA, Stauber JL, King CK, Chapman JC, et al. A.Handbook for Sediment Quality Assessment. Bangor, NSW: Centre for Environmental Contaminants Research. 2005.
- Kim HK, Jang TI, Kim SM, Park SW. Impact of domestic wastewater irrigation on heavy metal contamination in soil and vegetables. Environ Earth Sci. 2015; 73: 2377-2383.
- Ogoyi, DO, Mwita CJ, Nguu EK, Shiundu PM. Determination of heavy metal content in water, sediment and microalgae from Lake Victoria, East Africa. Open Environ Eng J. 2011; 4: 156-161.
- Shammas MI. Environmental monitoring and assessment: a case in Salalah, Oman. Environmental Monitoring and Assessment. 2021; 193: 700.
- Nama. Who We Are. 2022.
- Khaliq S, Ahmed M, Al-Wardy M, Al-Busaidi A, Choudri BS. Wastewater and sludge management and research in Oman: An overview. Journal of the Air & Waste Management Association. 2017; 67: 267-278.
- Al-Rawahi MN, Lee MY, Friesen J, Khurelbaatar G, Mueller R. A practical step towards sustainability: Decentralised wastewater management in Oman. Desalination and Water Treatment. 2020; 176: 360-369.
- HMR Environmental Engineering Consultants. Marine Environmental Assessment in the Sea outfall Location: Darsit Project No: HMR# 5049. 2024a: 61.
- HMR Environmental Engineering Consultants. Marine Environmental Assessment in the Sea outfall Location: Azaibah Project No: HMR# 5049. 2024b: 54.
- HMR Environmental Engineering Consultants. Marine Environmental Assessment in the Sea outfall Location: Al Seeb Project No: HMR# 5049. 2024c: 56.
- English S, Wilkinson C, Baker V. Survey Manual for Tropical MarineResources. Townsville: Australian Institute of Marine Science. 1997.
- HMR Environmental Engineering Consultants. Environmental Impact Statement – A’Seeb Wastewater Poject, Project No: HMR#2320. 2009: 317.
- Abdel-Magid IM, Rahman HAA. The Omani Regulations for Wastewater Reuse and Discharge-A Critical. Selected Papers in Environmental Engineering. 2009; 126.
- Ali H, Khan E. Trophic transfer, bioaccumulation, and biomagnification of non-essential hazardous heavy metals and metalloids in food chains/webs-Concepts and implications for wildlife and human health. Human and Ecological Risk Assessment. 2019; 25: 1353-1376.
- Naser HA. Marine ecosystem diversity in the Arabian Gulf: Threats and conservation. Biodiversity–The Dynamic Balance of the Planet. 2014: 297-328.
CONFLICTS OF INTEREST
The authors declare no conflicts of interest.
DATA AVAILABILITY STATEMENT
The original contributions presented in this study are included in the article/supplementary material. Further inquiries can be directed to the corresponding author(s).
INSTITUTIONAL REVIEW BOARD STATEMENT
The study was conducted in accordance with the Declaration of Helsinki, and approved by the Ethics Committee of Newcastle University [Approval Code: 1729/2020; Approval Date: 15/05/2020].
FUNDING
This research received no external funding.
AUTHOR CONTRIBUTIONS
All authors contributed to the article’s conceptualization. The first draft of the manuscript was written by A.A.-K.; the design of the project was shared between A.A.-K., T.G. and M.A.-K.; the literature search was caried out by A.A.-K.; the data was analyzed by A.A.-K., S. A.-S. and M.A.-K. ; the initial writing of the MSS was performed by A.A.-K. and S. A.S-; the critical editing of the MSS was performed by M.A.-K and S.A.S-; the revision of the MSS was performed by A.A.-K. and T.G.; the review of the article was provided by T.G. and A.A.-K; and the submission of the article was performed by T.G. All authors have read and agreed to the published version of the manuscript.
Recommendations
The study recommends six courses of action. First, the significant increases in copper and nickel call for targeted heavy metal removal strategies in Azaibah, including chemical precipitation, ion exchange, adsorption techniques using activated carbon or specialized resins before effluent discharge, and the use of advanced treatment technologies. Second, industrial zoning should be integrated with marine pollution management. New industrial permits should be evaluated through a spatial overlay of coastal vulnerability maps to prevent clustering of high emission sectors (e.g., electroplating, fabrication) near sensitive marine habitats. Third, the government should establish mandatory pretreatment standards for industrial wastewater. For example, the Environment Authority (EA) should issue an updated regulatory instrument — Pretreatment Limits for Heavy Metals in Industrial Wastewater — to be implemented under the framework of Royal Decree 131/2020. These limits should align with the UK Environmental Quality Standards (EQS), setting maximum permissible concentrations for key metals such as copper and nickel at ≤0.005 mg/kg. Fourth, monitoring and transparency should be strengthened. For example, continuous monitoring of sediment and seawater quality should take place to maintain compliance and rapidly detect potential exceedances. Given the impact that activities like sea outfall discharge can have, monitoring should occur during both operational and non-operational periods to establish comprehensive baseline data. The EA, in coordination with Haya Water and the Oman Water and Wastewater Services Company (OWWSC), should establish a digital platform for real-time monitoring of effluent quality, enabling data-driven enforcement and public accountability. Fifth, increasing awareness and training for operational staff on environmental best practices and emergency response measures are essential to enhance EMP effectiveness. Sixth, there should be a review of existing wastewater regulations every five years to align with technological advances and global marine protection frameworks, such as the Regional Organization for the Protection of the Marine Environment (ROPME) standards.
CONCLUSION
Summary
This study concludes that among the three surveyed regions, Seeb has achieved the most significant improvement in heavy-metal pollution control, largely due to the implementation of new wastewater treatment technologies and effective infrastructure management. Darsait remains environmentally stable, reflecting minimal industrial influence. In contrast, Azaibah requires closer monitoring and targeted mitigation, particularly concerning copper and nickel emissions, which appear to be linked to post-2020 industrial expansion. Overall, the results demonstrate that improved wastewater management can substantially reduce marine contamination, but industrial oversight remains a critical determinant of coastal water quality
DISCUSSION
This comparative analysis of seawater and sediment quality at the Darsait, Azaibah, and Seeb plants between the baselines of 2009/2012 and our 2022 surveys reveals several key conclusions. At the Darsait plant, while no exceedances were observed in 2022 for most seawater and sediment quality indicators compared to the 2012 baselines, it is worth noting three major positive trends – the large declines in chromium, strontium and to some extent nickel. At the Azaibah plant, there was a large decline in chromium, but a major rise in copper and a significant rise in nickel. At the Seeb plant, there was a noticeable reduction in nearly all metal traces.
It is beyond the scope of this study to provide definitive explanations for these shifts, but the increased levels of some metal contaminants are likely to be linked to industrial discharge, stormwater runoff, or untreated wastewater intrusion. The observed variations in heavy metal concentrations among Darsait, Azaibah, and Seeb appear closely linked to recent changes in regional industrial and wastewater infrastructure. For example, in Seeb, two new sewage treatment plants constructed in 2020 and 2021 employ advanced deep-treatment technologies, including tertiary filtration and activated carbon polishing. These upgrades have significantly improved the quality of effluent discharged into the marine environment, which may explain the marked decrease in heavy metals— particularly copper and nickel—observed in the 2022 data.
In contrast, the Azaibah area has experienced notable industrial expansion in recent years. After 2020, three metal-processing enterprises were established within a 5-kilometre radius of the coastal zone, each involved in electroplating and metal fabrication activities. The proximity of these facilities to the shoreline, combined with surface runoff and potential discharge through stormwater or sewage systems, may account for the localized increase in copper concentrations detected in 2022.
Meanwhile, Darsait remains primarily residential and administrative, with limited industrial activity; its stable heavy-metal profile is consistent with this land-use pattern. The results therefore suggest that regional industrial layout and the operation of wastewater infrastructure play a direct role in shaping the spatial patterns of heavy-metal contamination along Muscat’s coastline.
Comparing these findings with previous studies [26-45] suggests a general trend of environmental improvement in coastal seawater quality near advanced wastewater facilities, while areas with increasing industrial presence show localized contamination. However, there remain policy and enforcement gaps—notably, the absence of mandatory pretreatment limits for industrial wastewater prior to discharge into public sewage systems. This contrasts with international best practices, such as those in the UK and the Netherlands, which enforce sector-specific heavy-metal discharge standards.
Finally, we should note two research limitations of this study. First, the number of sampling sites was few in number and limited in time a single sampling year. Second, data was absence for Azaibah and Darsait prior to 2012, which constrains long-term trend analysis. Future studies should employ continuous monitoring and spatial modeling to better quantify pollutant sources and hydrodynamic dispersion patterns in Oman’s coastal zones.
Statistical Validation of Results
To quantify the reliability of observed differences among regions, statistical tests were conducted on the heavy metal concentration data. The Shapiro–Wilk test confirmed that most parameters followed normal distribution (p > 0.05), validating the use of parametric tests.
A one-way ANOVA revealed statistically significant spatial variations (p < 0.05) for copper, nickel, and chromium among the three study sites. Tukey’s post-hoc test indicated that:
- Copper concentrations were significantly higher in Azaibah compared to Seeb (p = 0.013).
- Nickel levels were notably lower in Seeb, confirming improved pollution control (p = 0.021).
- Chromium differences were not significant among sites (p = 0.134), consistent with natural background variation.
The coefficient of variation (CV) values ranged between 5.4% and 18.7%, indicating moderate variability among sampling sites.
Comparative regression analysis between 2009/2012 and 2022 data demonstrated a significant decline in copper (R² = 0.82, p < 0.001) and nickel (R² = 0.74, p < 0.01) levels in Seeb, while Azaibah exhibited a slight upward trend in copper concentrations (R² = 0.59, p = 0.047).
All mean concentrations and their 95% confidence intervals remained within or below international environmental limits (UK EQS), except for copper at certain Azaibah stations, which marginally exceeded the threshold.
These statistical findings reinforce the reliability of the 2022 dataset and provide quantitative validation of the observed spatial and temporal patterns in heavy metal concentrations.
Abstract
This study investigates heavy metal contamination in seawater and sediments in three coastal regions of Oman – Darsait, Azaibah and Seeb. In 2022, sample collections were made in subtidal ecosystems in these three areas, and the samples were analysed to assess the potential environmental impacts of treated wastewater. The study employed a comprehensive sampling strategy adhering to the Oman Environmental Impact Assessment (EIA) Guidelines to evaluate key parameters such as temperature, salinity, dissolved oxygen, and heavy metal concentrations (see Appendix 1). Results indicate that the levels of most heavy metals contamination had not changed significantly since the baseline surveys in 2009 and 2012, but that some levels were still above EIA guidelines. Recommendations are made to reduce these levels, ensuring the protection of marine environments and humans while supporting industrial growth. This research contributes to our understanding of anthropogenic impacts on marine ecosystems in Oman and highlights the importance of regular monitoring and adaptive management practices.
Sediment samples
Darsait
In the 2022 survey of Darsait, sediment samples were collected from five locations near the pipeline corridor and discharge area, focusing on heavy metals and various other parameters. Key findings include the following: chromium levels slightly exceeded the ISQG and PEL levels (see Appendix 4) in one location (SD2) but remained below the US-EPA threshold (see Appendix 5 for acceptable levels). Chromium is naturally occurring in marine environments and is reported in similar concentrations in other regions of Oman. All other heavy metals, including arsenic, cadmium, copper, and lead, were within ISQG and PEL levels, indicating minimal ecological impact from these pollutants at Darsait (see Table 5 and Figure 7).
Table 5: The sediment analysis in Darsait [38].
|
Parameters
|
Unit
|
Test
Method
|
Sample locations
|
Canadian Standards ISQG (see Appendix 4)
|
PEL
|
|
SD1
|
SD2
|
SD3
|
SD4
|
SD5
|
|
Arsenic
|
mg/kg
|
USEPA SW
846/6010
|
<10
|
<10
|
<10
|
<10
|
<10
|
7.24
|
41.60
|
|
Cadmium
|
<1
|
<1
|
<1
|
<1
|
<1
|
0.70
|
4.20
|
|
Chromium
|
35
|
34.1
|
30.7
|
33.8
|
34.9
|
52.30
|
160
|
|
Copper
|
5.53
|
3.96
|
3
|
4.08
|
3.98
|
18.7
|
108
|
|
Selenium
|
<10
|
<10
|
<10
|
<10
|
<10
|
-
|
-
|
|
Lead
|
<1
|
<1
|
<1
|
<1
|
<1
|
30.20
|
112
|
|
Mercury
|
<0.1
|
<0.1
|
<0.1
|
<0.1
|
<0.1
|
0.13
|
0.7
|
|
Barium
|
1.84
|
1.08
|
1
|
1.3
|
1.99
|
-
|
-
|
|
nickel
|
124
|
130
|
109
|
129
|
133
|
15.9
|
42.8
|
|
Vanadium
|
<10
|
<10
|
<10
|
|
|
-
|
|
|
Zinc
|
14.7
|
8.42
|
6.71
|
7.94
|
9.96
|
124
|
271
|
|
Silver
|
<1
|
<1
|
<1
|
<1
|
<1
|
-
|
|
|
Strontium
|
464
|
498
|
766
|
585
|
567
|
-
|
|
|
Tin
|
<10
|
<10
|
<10
|
<10
|
<10
|
|
|
Figure 7: Graphical representation of the sediment analysis in (Source: the lead author)

Azaibah
In the 2022 survey, five sediment samples were taken from Azaibah’s pipeline corridor and nearshore zones to analyze the same parameters as in Darsait. Key findings include, as observed at Darsait, chromium levels in one location (SD2) were slightly above ISQG and PEL standards, though still compliant with USEPA limits of below the threshold of 10 mg/kg (see Appendix 5). However, all other metal concentrations, along with BTEX and TPH, were well within the guidelines set by ISQG and PEL, indicating limited environmental impact in Azaibah (Table 6 and Figure 8).
Table 6: The sediment analysis in Azaibah location [39].
|
Parameters
|
Unit
|
Test
Method
|
Sample locations
|
Canadian Standards ISQG
|
PEL
|
|
SD1
|
SD2
|
SD3
|
SD4
|
SD5
|
|
Arsenic
|
mg/kg
|
USEPA SW
846/6010
|
<10
|
<10
|
<10
|
<10
|
<10
|
7.24
|
41.60
|
|
Cadmium
|
<1
|
<1
|
<1
|
<1
|
<1
|
0.70
|
4.20
|
|
Chromium
|
28.1
|
22.7
|
19.6
|
30.2
|
35
|
52.30
|
160
|
|
Copper
|
1.65
|
1.86
|
2.79
|
2.07
|
1.94
|
18.7
|
108
|
|
Selenium
|
<10
|
<10
|
<10
|
<10
|
<10
|
-
|
-
|
|
Lead
|
<1
|
<1
|
<1
|
<1
|
<1
|
30.20
|
112
|
|
Mercury
|
<0.1
|
<0.1
|
<0.1
|
<0.1
|
<0.1
|
0.13
|
0.7
|
|
Barium
|
4.96
|
4.05
|
4.9
|
2.48
|
1.94
|
-
|
-
|
|
Nickel
|
108
|
84.6
|
108
|
119
|
125
|
15.9
|
42.8
|
|
Vanadium
|
<10
|
<10
|
<10
|
<10
|
<10
|
-
|
|
|
Zinc
|
4.55
|
4.36
|
4.89
|
4.48
|
4.5
|
124
|
271
|
|
Silver
|
<1
|
<1
|
<1
|
<1
|
<1
|
-
|
|
|
Strontium
|
726
|
798
|
897
|
870
|
722
|
-
|
|
|
Tin
|
<10
|
<10
|
<10
|
<10
|
<10
|
|
|

Figure 8: Graphical representation of the sediment analysis in Azaibah (Source: the lead author).
Seeb
In the 2022 Seeb survey, five sediment samples were collected, covering heavy metals, and other chemical constituents. Key findings include the following:
Similar to Darsait and Azaibah, chromium levels exceeded ISQG in one location (SD2) but remained within USEPA guidelines, confirming that chromium concentrations are naturally high in the region. However, all other analytes were within ISQG and PEL limits, affirming that overall sediment quality and marine health were stable despite effluent discharge (see Table 7 and Figure 9).
Table 7: The sediment analysis in Seeb location [40].
|
Parameters
|
Unit
|
Test
Method
|
Sample locations
|
Canadian Standards ISQG
|
PEL
|
|
SD1
|
SD2
|
SD3
|
SD4
|
SD5
|
|
Arsenic
|
mg/kg
|
USEPA SW
846/6010
|
<10
|
<10
|
<10
|
<10
|
<10
|
7.24
|
41.60
|
|
Cadmium
|
<1
|
<1
|
<1
|
<1
|
<1
|
0.70
|
4.20
|
|
Chromium
|
31.7
|
28
|
30.7
|
26.1
|
20.4
|
52.30
|
160
|
|
Copper
|
3.96
|
2.66
|
1.86
|
2.02
|
20.4
|
18.7
|
108
|
|
Selenium
|
<10
|
<10
|
<10
|
<10
|
<10
|
-
|
-
|
|
Lead
|
<1
|
<1
|
<1
|
<1
|
<1
|
30.20
|
112
|
|
Mercury
|
<0.1
|
<0.1
|
<0.1
|
<0.1
|
<0.1
|
0.13
|
0.7
|
|
Barium
|
1.98
|
2.5
|
1.86
|
3.1
|
4.85
|
-
|
-
|
|
Nickel
|
138
|
110
|
125
|
89
|
71.7
|
15.9
|
42.8
|
|
Vanadium
|
<10
|
<10
|
<10
|
<10
|
<10
|
-
|
|
|
Zinc
|
2.97
|
2.57
|
6.71
|
2.1
|
1.94
|
124
|
271
|
|
Silver
|
<1
|
<1
|
<1
|
<1
|
<1
|
-
|
|
|
Strontium
|
461
|
496
|
639
|
628
|
641
|
-
|
|
|
Tin
|
<10
|
<10
|
<10
|
<10
|
<10
|
|
|

Figure 9: Graphical representation of the sediment analysis in Seeb (Source: the lead author).
RESULTS OF THE FIELDWORK CONDUCTED IN 2022
Seawater samples
Results of seawater analysis in Darsait
The seawater analysis from Darsait showed that several heavy metals, including arsenic, cadmium, chromium, lead, mercury, nickel, vanadium, silver, and barium, were below detection limits. Copper was detected at 0.02 mg/L at seawater site (SW) 2 and 5, slightly exceeding the UK EQS limit of 0.005 mg/L, while other locations showed values of 0.01 mg/L. Zinc levels ranged from 0.02 to 0.04 mg/L, with SW5 at the higher end, at the UK EQS limit of 0.04 (see Table 2 and Figure 4).
Table 2: The seawater analysis in Darsait [38].
|
Parameters
|
Unit
|
Test
Method
|
MDL
|
Sample locations
|
UK EQS Limit
|
|
SW1
|
SW2
|
SW3
|
SW4
|
SW5
|
|
Arsenic
|
Mg/kg
|
APHA 3120
B
|
|
<0.01
|
<0.01
|
<0.01
|
<0.01
|
<0.01
|
0.025
|
|
Cadmium
|
0.003
|
<0.01
|
<0.01
|
<0.01
|
<0.01
|
<0.01
|
0.0025
|
|
Chromium
|
0.02
|
<0.01
|
<0.01
|
<0.01
|
<0.01
|
<0.01
|
0.015
|
|
Copper
|
0.02
|
0.01
|
0.02
|
0.01
|
0.01
|
0.02
|
0.005
|
|
Lead
|
0.01
|
<0.01
|
<0.01
|
<0.01
|
<0.01
|
<0.01
|
0.025
|
|
Zinc
|
0.1
|
0.02
|
0.02
|
0.03
|
0.02
|
0.03
|
0.04
|
|
Mercury
|
|
<0.001
|
<0.001
|
<0.001
|
<0.001
|
<0.001
|
0.0003
|
|
Nickel
|
0.02
|
<0.01
|
<0.01
|
<0.01
|
<0.01
|
<0.01
|
0.03
|
|
Vanadium
|
|
<0.01
|
<0.01
|
<0.01
|
<0.01
|
<0.01
|
0.1
|
|
Silver
|
|
<0.01
|
<0.01
|
<0.01
|
<0.01
|
<0.01
|
0.0005
|
|
Barium
|
0.1
|
<0.01
|
<0.01
|
<0.01
|
<0.01
|
<0.01
|
Not established
|
|
Selenium
|
|
<0.01
|
<0.01
|
<0.01
|
<0.01
|
<0.01
|
Not established
|
|
Strontium
|
|
9.99
|
9.44
|
9.58
|
9.62
|
9.08
|
Not established
|
|
Tin
|
|
<0.01
|
<0.01
|
<0.01
|
<0.01
|
<0.01
|
<0.01
|

Figure 4: Graphical representation of the seawater analysis in Darsait (Source: the lead author)
Overall, the seawater quality appears to meet environmental standards, with minor exceptions in copper levels.
Results of seawater analysis in Azaibah
The seawater analysis from Azaibah’s five sample points (SW1 to SW5), produced the following key findings. Arsenic, cadmium, and chromium were below detection limits; copper ranged from <0.03 to 0.04 mg/L, which is within Omam’s EIA Guidelines’ acceptable levels of 0.005 mg/L; and zinc ranged from 0.02 to 0.06 mg/L. which marginally breached Oman’s EIA Guidelines’ acceptable level of 0.04 mg/L. Overall, seawater quality appears to have low levels of pollutants, generally adhering to environmental quality standards (see Table 3 and Figure 5).
Table 3: The seawater analysis in Azaibah [39].
|
Parameters
|
Unit
|
Test
Method
|
MDL
|
Sample locations
|
UK EQS
Limit
|
|
SW1
|
SW2
|
SW3
|
SW4
|
SW5
|
|
|
Arsenic
|
Mg/kg
|
APHA 3120
B
|
0.01
|
<0.01
|
<0.01
|
<0.01
|
<0.01
|
<0.01
|
0.025
|
|
Cadmium
|
0.003
|
<0.01
|
<0.01
|
<0.01
|
<0.01
|
<0.01
|
0.0025
|
|
Chromium
|
0.02
|
<0.01
|
<0.01
|
<0.01
|
<0.01
|
<0.01
|
0.015
|
|
Copper
|
0.02
|
0.04
|
<0.03
|
0.04
|
0.02
|
0.03
|
0.005
|
|
Lead
|
0.01
|
<0.01
|
<0.01
|
<0.01
|
<0.01
|
<0.01
|
0.025
|
|
Zinc
|
0.1
|
0.02
|
0.03
|
0.06
|
0.04
|
0.02
|
0.04
|
|
Mercury
|
|
<0.001
|
<0.001
|
<0.001
|
<0.001
|
<0.001
|
0.0003
|
|
Nickel
|
0.02
|
<0.01
|
<0.01
|
<0.01
|
<0.01
|
<0.01
|
0.03
|
|
Vanadium
|
|
<0.01
|
<0.01
|
<0.01
|
<0.01
|
<0.01
|
0.1
|
|
Silver
|
|
<0.01
|
<0.01
|
<0.01
|
<0.01
|
<0.01
|
0.0005
|
|
Barium
|
|
<0.01
|
<0.01
|
<0.01
|
<0.01
|
<0.01
|
Not established
|
|
Selenium
|
|
<0.01
|
<0.01
|
<0.01
|
<0.01
|
<0.01
|
Not established
|
|
Strontium
|
|
7.13
|
8.04
|
10.2
|
10.6
|
10.8
|
Not established
|
|
Tin
|
|
<0.01
|
<0.01
|
<0.01
|
<0.01
|
<0.01
|
0.01
|

Figure 5: Graphical representation of the seawater analysis in Azaibah (Source: the lead author).
Results of seawater analysis in Seeb
The seawater analysis at Seeb involved testing various parameters across five sample locations (SW1-SW5) to assess water quality. Heavy metal analysis indicated that arsenic, cadmium, chromium, and lead were below detectable limits in all samples. Copper was detected with concentrations of 0.03 mg/L in SW1 and SW3, 0.02 mg/L in SW4 and SW5, and below the detection limit in SW2, all below the 0.05 acceptable Oman EIA Guidelines level. Zinc levels varied, with SW2 showing levels below the detection limit, while other locations ranged from 0.03 to 0.04 mg/L which are below or at the acceptable limit set by Oman’s EIA Guidelines. Mercury, nickel, vanadium, silver, barium, selenium and tin were all below detectable limits, while strontium levels ranged from 1.1 to 12.6 (see Table 4 and Figure 6). Overall, the results suggest that the seawater quality at Seeb is generally good, with no significant heavy metal contamination detected.
Table 4: The seawater analysis in Seeb [40].
|
Parameters
|
Unit
|
Test
Method
|
MDL
|
|
S
|
ample locatio
|
ns
|
|
UK EQS Limit
|
|
SW1
|
SW2
|
SW3
|
SW4
|
SW5
|
|
Arsenic
|
Mg/kg
|
APHA 3120 B
|
0.01
|
<0.01
|
<0.01
|
<0.01
|
<0.01
|
<0.01
|
0.025
|
|
Cadmium
|
0.003
|
<0.01
|
<0.01
|
<0.01
|
<0.01
|
<0.01
|
0.0025
|
|
Chromium
|
0.02
|
<0.01
|
<0.01
|
<0.01
|
<0.01
|
<0.01
|
0.015
|
|
Copper
|
0.02
|
0.03
|
<0.01
|
0.03
|
0.02
|
0.02
|
0.005
|
|
Lead
|
0.01
|
<0.01
|
<0.01
|
<0.01
|
<0.01
|
<0.01
|
0.025
|
|
Zinc
|
0.1
|
0.04
|
<0.01
|
0.04
|
0.04
|
0.03
|
0.04
|
|
Mercury
|
|
<0.001
|
<0.001
|
<0.001
|
<0.001
|
<0.001
|
0.0003
|
|
Nickel
|
0.02
|
<0.01
|
<0.01
|
<0.01
|
<0.01
|
<0.01
|
0.03
|
|
Vanadium
|
|
<0.01
|
<0.01
|
<0.01
|
<0.01
|
<0.01
|
0.1
|
|
Silver
|
|
<0.01
|
<0.01
|
<0.01
|
<0.01
|
<0.01
|
0.0005
|
|
Barium
|
|
<0.01
|
<0.01
|
<0.01
|
<0.01
|
<0.01
|
Not
established
|
|
Selenium
|
|
<0.01
|
<0.01
|
<0.01
|
<0.01
|
<0.01
|
Not
established
|
|
Strontium
|
|
11.9
|
12.6
|
11.8
|
10.8
|
1.1
|
Not
established
|
|
Tin
|
|
<0.01
|
<0.01
|
<0.01
|
<0.01
|
<0.01
|
0.01
|

Figure 6: Graphical representation of the seawater analysis in Seeb (Source: the lead author).
Statistical Analysis
All quantitative data obtained from seawater and sediment samples were analyzed using Python (version 3.11), with data processing and statistical testing performed through the NumPy, SciPy, and Pandas libraries.
After data cleaning and normalization, the following statistical analyses were conducted:
Descriptive Statistics:
For each heavy metal parameter, the mean, standard deviation (SD), and coefficient of variation (CV) were calculated to quantify central tendency and relative dispersion across sample sites.
Normality Testing:
Data were tested for normality using the Shapiro–Wilk test to determine the appropriate choice of subsequent parametric or non parametric tests.
Inferential Analysis:
- A one-way Analysis of Variance (ANOVA) was applied to compare heavy metal concentrations among the three sites (Darsait, Azaibah, and Seeb).
- Where significant differences were detected (p < 0.05), Tukey’s Honest Significant Difference (HSD) post-hoc test was used to identify which pairs of sites differed significantly.
- When normality assumptions were violated, a Kruskal–Wallis H-test was performed as a non-parametric alternative.
Trend and Correlation Analysis:
- Pearson’s correlation coefficient (r) was calculated to assess the linear relationships between selected metals (e.g., copper and nickel) and potential anthropogenic indicators such as distance from sewage outfalls.
- Linear regression analysis was performed to examine temporal trends between historical data (2009/2012) and 2022 results.
Confidence Intervals:
- 95% confidence intervals (CI) were computed for all mean concentration values to assess statistical precision.
All statistical tests were conducted at a significance level of α = 0.05. Results that met or exceeded this threshold were considered statistically significant.
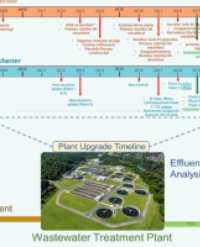
The Seeb Sewage Treatment Plant (SSTP)
The SSTP (see Figure 3), which is located along the Seeb coastline in Muscat, has been operational since 2014.
Figure 3: The Seeb Sewage Pipeline Area [40].

A marine survey was carried out in 2022 to assess the ecological status of these three marine habitats within a 300-meter radius of each outfall. The methodology adhered to the standards outlined in the Survey Manual for Tropical Marine Resources [41]. Surface seawater and sediment samples were collected from several places within each location’s subtidal area, including the outfall, the edge of the mixing zone, and an external control point. Sampling occurred during plant shutdown to guarantee precise conditions without interference from brine discharge. The sampling involved obtaining five seawater and five sediment samples per site. Both seaweater and sediment samples were collected to measure traces of the following heavy metals: aluminium, arsenic, barium, cadmium, cobalt, chromium, copper, iron, manganese, molybdenum, nickel, lead, and zinc. The sampling for seawater was carried out using a 2.5-liter Niskin water sampler, collecting samples from the mid-water column. Samples were then decanted into laboratory specified containers for analysis. To ensure comparability with sediment data, seawater sampling locations were positioned close to the identified sediment sampling sites. The sampling for sediments was carried out using a grab sampler (a Van Veen or Ponar grab) to collect the upper layer of sediment from predetermined locations. The sampler was lowered from a research vessel to the seabed and upon contact, the sampler’s jaws closed, securing a sample of the top few centimeters of sediment. These samples were then carefully transferred into pre-cleaned, labeled containers to avoid cross-contamination. All collected samples were kept at low temperatures during transport to the laboratory, where they underwent further processing and analysis according to quality assurance protocols.
The collected data from both seawater and sediment samples were analysed in three stages using Python, a robust programming language. The first stage involved data-cleaning techniques, including data filtering to reduce noise; data duplication to eliminate duplicate records; data standardization to bring all data into a consistent format; and data aggregation to group data by categories such as time periods. The second stage involved statistical analysis including the calculation of summary statistics—such as mean, variance, and standard deviation— as well as regression analysis and correlation matrices. Finally, the third stage involved data visualization, to create graphical representations of patterns, trends, and relationships. The guidelines used to determine whether samples met environmental health standards were the UK EQS limits (see Appendix 3).
The Azaibah Sewage Treatment Plant (ASTP)
The ASTP (see Figure 2), which is located in the coastal Azaibah area of Muscat, has been operational since 2018.

The Darsait Sewage Treatment Plant (DSTP)
The DSTP (see Figure 1), which is situated close to the Darsait coastline, has been operational since 2020.
Figure 1: The Darsait Sewage Pipeline Area [38].

METHODS AND MATERIALS
This study assessed sewage wastewater in three disposal sites used for the discharge of treated water and emergency raw sewage into the marine environment on Oman’s coastline, analysing their levels of heavy metal contamination. These three sites were selected for their availability of water quality data and their extended operational history of sewage discharge.
OMAN’S SYSTEM OF POLICY MAKING ON MARINE POLLUTION.
In Oman, the legal regulatory system has three levels: the main regulations are released as Royal Decrees; laws are issued as Ministerial Decisions; and detailed guidelines or rules are provided by the relevant Directorate General. There are four Royal Decrees on marine pollution; five ministerial decisions on wastewater management marine pollution (Albusaidi, 2019; Al-Bahlani & Mabry, 2014; Qanoon, 2022); and many guidelines or rules or parameters restricting the amount of specific physical, chemical and bacteriological substances (radioactive materials are strictly forbidden).
Table 1: Parameters for re-use of discharged wastewater (source: Abdel-Magid and Al Zawahry (1992).
|
Parameter
|
Limits [not greater than] in mg/kg
|
Monthly average limits. over any 4 consecutive weeks in mg/kg
|
|
Chemical
|
|
Aluminum
|
5
|
1
|
|
Arsenic
|
0.2
|
0.05
|
|
Barium
|
2
|
1
|
|
Beryllium
|
0.3
|
0.1
|
|
Cadmium
|
0.03
|
0.01
|
|
Chromium
|
0.5
|
0.1
|
|
Cobalt
|
0.5
|
0.1
|
|
Copper
|
0.3
|
0.2
|
|
Lead
|
0.5
|
0.1
|
|
Lithium
|
10
|
2.5
|
|
Manganese
|
1
|
0.2
|
|
Mercury
|
0.005
|
0.001
|
|
Molybdenum
|
0.05
|
0.01
|
|
Nickel
|
0.5
|
0.2
|
|
Selenium
|
0.05
|
0.02
|
|
Vanadium
|
1
|
0.1
|
|
Zinc
|
5
|
2
|
Table 1 sets out the limits or parameters of heavy metals that are allowed in re-used wastewater.
The Environment Authority (EA) is the governmental body with overall responsibility for implementing these marine pollution controls. It manages the risks associated with wastewater discharges and collaborates with other relevant agencies to monitor the potential impacts of wastewater discharge from desalination plants [34]. However, day-to-day management of marine pollution is the responsibility of the Oman Water and Wastewater Services Company (OWWSC) which was established in 2020 as a public utility provider under Royal Decree 131/2020 to manage water and wastewater services across all governorates of the Sultanate, except for the Governorates of Dhofar and Muscat. Dhofar is managed by Nama Dhofar Services [35] while Haya Water (HW) (a government owned entity) was established by Ministerial Decision No. 31/2002 on December 17, 2002 [36] to design and manage the wastewater collection and treatment system in the Muscat Governorate. Both OWWSC and Nama Dhofar Services continuously assess the impact on the marine environment of the disposal of treated water and emergency raw sewage discharge [37].
INTRODUCTION
Heavy metals are recognized as a major anthropogenic contaminant in coastal and marine environments around the globe [1]. Due to their toxicity, persistence in the environment, and ability to bioaccumulate, these metals present a serious risk to marine organisms, entire ecosystems and human health [2]. Their presence in marine ecosystems leads to habitat degradation by reducing species diversity and abundance, while also causing the accumulation of metals in marine organisms which can penetrate and disrupt food chains [3]. Several heavy metal ions are carcinogenic to humans [4,5]. Heavy metals can be introduced into coastal and marine environments by various anthropogenic activities, including industrial processes, wastewater discharge, domestic effluents, and agricultural runoff [6]. These contaminants, once in the marine environment, have long-lasting effects due to their non-biodegradable nature and can persist for years, further exacerbating their impact on the environment [4].
In the Arabian Gulf, heavy metal contamination is becoming a matter for concern, posing an increasing threat to both the naturally stressed marine ecosystems and the human populations that depend on these resources for food, industry, and recreation [7]. The Arabian Gulf, a semi-enclosed sea located in the subtropical zone, is characterized by pronounced fluctuations in sea temperature, low PH levels and elevated salinity levels. It is a relatively shallow basin, with an average depth of around 35 meters [8]. The flora and fauna inhabiting this region are exposed to one of the most extreme marine environments globally, [9]. Marine organisms that are native to the Arabian Gulf exist near the upper limits of their environmental tolerance, making them particularly vulnerable to additional stressors such as pollution [10]. Despite these challenging conditions, the Gulf supports a range of coastal and marine habitats, including mangrove swamps, seagrass beds, coral reefs, and extensive mud and sand flats [11]. These ecosystems serve as essential feeding and nursery grounds for a diverse array of marine life, including commercially important species [12].
However, the introduction of heavy metals through industrial discharges, wastewater, and runoff has compounded the stress on these ecosystems. The bioaccumulation of heavy metals in marine species, combined with the region’s harsh natural environment, threatens to accelerate the decline of biodiversity, disrupt food webs, and impact fisheries that are vital for the national economy and local livelihoods [13]. Over the past decades, countries surrounding the Arabian Gulf have experienced major economic, social, and industrial change, leading to extensive development and modification of the Gulf’s coastlines [14]. Activities such as dredging, land reclamation, industrial discharges, sewage effluents, hypersaline water from desalination plants, and oil pollution are prominent anthropogenic stressors contributing to the environmental degradation of the Gulf [8], making it one of the most anthropogenically impacted marine regions in the world [15]. These human activities have resulted in the mobilization and release of elevated levels of heavy metals into the Gulf’s marine environment [16]. The relatively slow seawater flushing rate, estimated at 3 to 5 years [17], exacerbates the issue by allowing pollutants like heavy metals to persist and accumulate over time, posing long-term threats to marine ecosystems and the quality of seafood consumed by humans [18,19].
This case study centres on the Sea of Oman which is located at the southern end of the Gulf and is part of the Regional Organization for the Protection of the Marine Environment (ROPME) Sea Area [20]. Situated in an arid zone with scarce freshwater resources, the region relies on desalination as a viable source of freshwater. The discharge of brine from desalination plants [21] and effluents from sewage treatment facilities [22] are key contributors to pollutants that alter the biological and physico-chemical properties of the Sea of Oman: the salinity levels of discharged brine range between 9.8 and 61.2 mS/cm [23]. The present study is particularly focused on heavy metals found in sewage effluents. Despite the generally high standards of sewage treatment across the Gulf countries [8], substantial quantities of domestic effluents are currently discharged into coastal and marine environments. These effluents are rich in suspended solids and carry high concentrations of nutrients such as ammonia, nitrate, and phosphate, which can contribute to eutrophication and other negative ecological impacts [11]. In addition to these nutrients, sewage discharges often contain a range of biological and chemical pollutants, including heavy metals [24,25]. A study by Naser, et al. [26], identified wastewater sewage originating from residential, commercial, and industrial sources as a key pollutant in the Arabian Gulf’s coastal areas, where it introduced heavy metals, pathogens, and high nutrient loads despite advanced sewage treatment standards. Naser’s study reveals localized contamination hotspots near sewage outfalls. This issue is important for public health. In Oman, according to Baawain et al. [27], there is a pressing need for large-scale re-use of treated wastewater effluents in the Muscat Governorate.
This paper focuses on sewage treatment in Oman as a cause of heavy metal concentration in seawater. There have been previous studies of wastewater sewage in Oman. The most recent study was Baawain, et al., [27] which researched the sustainable re-use of treated wastewater in Muscat, highlighting the quality of treated effluents and their compliance with local standards, and discussing the presence of contaminants such as nitrates and E. coli. An earlier study by Baawain, et al., [27] concentrated on three regions - Muscat, Sohar, and Salalah - collecting and analysing wastewater samples from six sewage treatment plants during a year, assessing both raw sewage and treated effluents. That study found that treated effluents generally met Omani Environmental Impact Assessment (EIA) standards (see Appendix 1), although some parameters like nitrate and E. coli exceeded acceptable limits. However, neither of these two studies tested for metal contaminants.
Three studies which did test for metal contaminants were carried out by third party companies for the Environment Authority in 2009 and 2012. In 2009, a baseline survey of surface water quality was conducted in which seawater samples were taken from five stations within the sewage outfall corridor for Seeb, and in 2012 from two outfalls in Darsait, and Azaibah. The samples were collected using a Quanta Hydrolab multi parameter process [29,30] and tested for heavy metal concentration using the Dutch EIA Standards guidelines (see Appendix 2).
Arsenic was detected at all sites with values ranges between 6 mg/kg to 12 mg/kg, but in concentrations lower than the acceptable background level set by the Dutch Standards.
Cadmium was only detected in all sites at concentrations of 0.1 mg/ kg, which is below the acceptable background level set by the Dutch Standards.
Chromium was detected at all sites with values ranging from 67 mg/ kg to 81 mg/kg. All sites were found to have chromium concentrations that were below the acceptable background level based on the Dutch Standards.
Copper was detected in all sites with values ranging from 20 mg/kg up to 28 mg/kg, which is below the acceptable background level set by the Dutch Standards.
Mercury was detected in all sampling locations at levels between 0.02 and 0.04mg/kg, which is below the acceptable background level set by the Dutch Standards.
Nickel was detected in all locations with values ranging from 190 to 370 mg/kg, which far exceeds the acceptable threshold set by the Dutch Standards.
Lead was detected at all locations ranging from 4 to 7 mg/kg, which is below the acceptable level set by the Dutch Standards.
Vanadium was detected at all locations ranging from 26 to 30 mg/ kg, which is below the acceptable background level set by the Dutch Standards.
Zinc was detected at all locations ranging from 22 to 33 mg/kg, which are below the acceptable background level set by the Dutch Standards.
In 2012, a sediment baseline survey was carried out in Darsait and Azaibah using a sediment quality assessment process [31]. The following provides a summary of the results for heavy metal contamination:
- Arsenic: Range 0.36 to 2.9420 mg/kg and a mean concentration of 1.3120 mg/kg, which exceeds the Dutch Standards
- Cadmium was absent.
- Chromium: Range 50.54 to 101.20 mg/kg and a mean concentration of 74.95 mg/kg, which exceeds the Dutch Standards standards
- Copper: Range 0.92 to 10.28 mg/kg and a mean concentration of 6.56 mg/kg, which is below the Dutch Standards
- Mercury not detected..
- Nickel: Range 169.2 to 349.0 mg/kg and a mean concentration of 237.2 mg/kg, which exceeds the Dutch Standards.
- Lead: Range 1.05 to 2.06 DPC1/DPC2 and a mean concentration of 559 mg/kg, which is below the Dutch Standards.
- Vanadium: Range 1.58 to 9.7820 mg/kg) and a mean 6.74 mg/ kg, which. exceeds by Dutch Standards.
- Zinc: Range 6.56 to 21.56mg/kg) and a mean of 15.89 mg/kg, which are below Dutch Standards.
The present study sought to compare these 2009/2012 values of heavy metals with current values by conducting a field survey in 2022 around sewage disposal sites of treatment of water and emergency raw sewage discharge in three areas - Darsait, Azaibah, and Seeb. Measurements of the presence of heavy metals were taken at multiple stations, including those near the sewage plant intakes and other sites located at varying distances from the outfalls. The study provides a comparative analysis of heavy metal contamination in seawater and sediments in these three locations and their surrounding marine environments [32,33]. The results of this field study are set out in section 4.
Section 2 provides a context on the system of policy making in Oman on marine pollution. Section 3 outlines the methodology used in the present study’s investigation of the link between sewage effluence and heavy metal contamination in three locations in the Oman Sea. Section 4 presents the results of that investigation. Section 5 discusses the implications of the results. Section 6 concludes the paper with a summary of its findings together with a list of recommendations to policy makers.
Citation
Kamzari AA, Shehhi SA, Kalban MA, Gray T (2025) Heavy Metal Contamination in Seawater in Darsait, Azaibah and Seeb in Oman: An As sessment of Environmental Pollution. Ann Environ Sci Ecol 5: 16.