Research Article | Volume 3 - Issue 2 | Article DOI :
Download PDF
Arkadiy Dantsker1*, Oscar Zhuk1 and Jane Brito1
1Detex Analytics, USA
Corresponding Author:
Arkadiy Dantsker, Detex Analytics, USA
Keywords
Wildfire; Water; Contamination; Source; Detection; Inverse Engineering; Theory of Hypernumbers
Abstract
The paper introduces a machine learning method of detecting multiple sources of water contamination caused by wildfire. The method includes changing the water flow regime, monitoring the time series of the contaminant concentration caused by regime changes, and associating the signature of the contaminant changes over time with sources locations. The contaminant signature from multiple sources starting at the moment of changing water velocity are defined by extending the approach for one contamination source. The intensity, location of each source, and diffusion coefficient are defined to satisfy the minimum square between monitoring and theoretical concentrations. The equations derived from the criteria of the best fit between experimental and modeling data are solved using the theory of hypernumbers. The initial values for hypernumber solutions are computed using the transient process of contaminant transport curve analysis. The defined in this paper algorithm can by used for detecting location of the arbitrary impurity in water network system.
Citation
Dantsker A, Zhuk O, Brito J (2025) Detecting Sources of Drinking Water Contamination Originated by Wildfires. Ann Environ Sci Ecol 5(1): 4.
INTRODUCTION
The Contaminant Release into Water Distribution Systems as a Wildfire Consequence
Wildfires in urban areas are often the cause of drinking water contamination [1,2].
The mechanisms of the pollution release in the water supply system are covered below:
Contaminant Release Due to Heat Damage to Pipes: Intense heat from wildfires can degrade plastic pipes and fittings, releasing volatile organic compounds (VOCs). Wildfires can introduce VOCs, such as benzene and toluene, into water systems due to the overheating plastics material [3]. Two ways overheated pipes introduce contamination are provided in recent research [4]. The paper lists methods for plastic pipe thermal state diagnostics. The modeling of the thermal impact on the pipe is covered in a research paper [5]. The research covers experiments to determine the critical temperature and duration of heating at which contaminants migrate from pipes to contained water [6,7].
Contaminant leaks into the pipeline due to loss of pressure: Firefighting efforts and system damage can lead to loss of water pressure, allowing contaminated water (including water containing bacteria) to be sucked into the system through leaks or damaged infrastructure [8].
Smoke and Ash Intrusion: As water systems lose pressure and drain, smoke containing chemicals can be drawn into the enumerate the pipes.
According to analysis covered in a recent publication [9], addressing damage to these systems from a wildfire has been insufficient, conflicting or inaccurate.
The Directions for Securing Pipeline from Contaminations
The methods of detecting pipes that release toxic chemicals due to the thermal impact of a wildfire is covered in a research paper. [4] are listed below.
The RFID sensor, which does not need batteries and, when triggered, emits a signal that can be scanned. The goal is to put RFID sensors on the laterals of the fire hydrants, which are evenly spaced throughout the communities and buried at the same depth as the vulnerable part of the laterals of the service
Color indicator sensor to let homeowners know if they should replace their pipes after a fire.
Water pipe temperature sensors provide a valuable tool for identifying potential water contamination risks. However, the drawbacks to such system implementation include:
Deploying sensors across a complex network of pipes in fire areas where fire has a high tendency to occur might be expensive and logistically challenging.
Maintenance and cost: The reliability and longevity of sensors in harsh environments and the potential need for frequent maintenance could be a significant factor for cost and feasibility.
For such a reason, there should be alternative methods for detecting pipes that are the source of water contamination.
The method of detecting the location of a source of contaminant in underground water pipes has been identified in a research publication [10]. The method can be extended to multiple sources and such an approach is covered in the following.
THE METHOD OF LOCATING THE CONTAMINANT RELEASE INTO THE WATER DISTRIBUTION SYSTEM FROM OVERHEATED OR DAMAGED PIPES
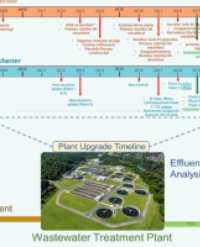
The method of detecting the location of contaminant release sources in the main distribution system from multiple lateral service lines is shown in Figure 1. Water contamination is monitored by Total Dissolved Solids (TDS) sensors. The most common toxics released from the plastic pipe at temperatures exceeding the threshold for such release [3] are: bromodichloromethane, chloroform and trihalomethanes Such ingredients are dissolved solids. Due to this, the location of the thermally damaged pipe can be defined by following the origins of TDS release. In case of loss of pressure due to thermal damage to the pipe structure,the surrounding solids leak into the water supply system. Some of the solids are dissolved and the source can be detected with the proposed method. The transient process of the contaminant dynamic is analyzed using the source location identification algorithm software installed on the Raspberry PI computer.
The approximation of the signature of the contaminant from two sources is shown in Figure 2.

Figure 1: Locating the source of water contamination from the damaged pipes. The schema is extender from the Ritcher et al. chart.

Figure 2: The transient process of contaminant concentration changes from multiple sources
Based on the assumption that the transport of contaminants from each source does not depend on another one from the set of sources, the concentration can be defined as the sum of each source following the approach in the research paper [10].

(1) The ill-posed problem for contaminant transport inverse engineering is defined with operator minimizing square difference between theoretical and monitoring contaminant concentrations.

The system of equations (3) is defined to satisfy operator L

The partial derivatives of the contamination concentration c_i^theor are identified in (4-6) using expression (1).


The solution for complex non-linear equations (4) is defined with theory of hypernumbers [11,12] and derived from this theory method of solving operator equations [13], where hypernumber solutions d_ (l,s)^h,m_(pol,l,s)^h,D_s^h for d_l,m_(pol,l),D are the sequences:

The method of finding solutions for hypernumbers deviations is covered in research papers [14,15].
The  are identified by analyzing the form of the transient concentration curve by detecting the start of the elevation of the concentration and the difference between the stabilized concentrations before and after the elevation.

where e i t l the consequent start time of increasing concentration, ∆ci the difference The between consequent stable concentrations.
The e i and ∆ci are shown in Figure 2. The algorithm is defined for arbitrary amount of pollutant sources.
ANALYSIS AND DISCUSSION
The critical part of methods applicability is accuracy in detecting the sources of the pollutant release in the water distribution system. The experimental proven of high accuracy in detecting source location was provided in a scalable water system. Per distance between dissolved salt release into the pipe and the sensor is 5 meters, the error for such contaminant source evaluation equals to 6%. The transition from theoretical models to high-scale simulation with an arbitrary number of sources is a next step for real-life application. As is stated above, the regular monitoring of the level of the dissolved solids won’t allow us to find the source, because such measuring would show the stable pollutant’s level. As proposed in this research method, the signature of the pollutant release is created by changing the water stream rate. The water rate is changed using the valves. The model considers that rate change is a step function. However, manual or automated valve control takes time and during this time the rate is gradually changed from initial to the final value. Such difference between theoretical and real transition rates will affect the method accuracy. On the other hand, a high quality control system would allow us to minimize such differences. Taking in account the rate change dynamic would lead to increasing the model complexity. At the same time, such a stochastic model of contaminant transport in a transient rate regime would be subject to consideration. The transient regime model for one source, derived from the approaches covered in [16], is defined for contaminant transport in a drainage system and can be extended to multiple sources.
The most significant release of toxic ingredients due to the high temperature per scientific paper [3] are: bromodichloromethane, chloroform and trihalomethanes. Such ingredients are dissolved solids. The simulation provided in the research paper [17] shows the average amount of benzene, toluene, ethylbenzene, and xylene leaching into water from plastic pipe at 400 °C. The level of benzene, dichloromethane, styrene, tert-buty alcohol, toluene and vinyl chloride detected in water system as a consequence of fire for multiple fire’s events are presented by Proctor et al [18]. The drop in water pressure due to pipe damage causes contamination from a variety of pollutants sucked into the system, including per- and polyfluoroalkyl substances (PFAS) and bacteria.
To define the health risk from the contaminant leak into the water supply, it is critical to monitor the amount of each individual toxic ingredient or bacteria. However, for the source of the pollutant localization, any of them can be used for detecting its location. Because per any pollutants released into the water, the dissolved solids always exist, the most rational approach reveals to use Total Dissolved Solid (TDS) sensors for data acquisition and detecting location with the provided algorithm.
CONCLUSIONS
The proposed method allows solving the complex problem of detecting pipes that release contamination in the water distribution system. The method is inexpensive and does not require permanent device installation for such identification. The arbitrary number of sources can be identified. The method can be used for any process in which multiple sources of contamination affect the system. The unknown parameters are computed by solving a nonlinear equation using the theory of hypernumbers. For a large amount of contaminant sources, the complexity of the algorithm can be decreased by sequentially using computational approach covered in this research. Such approach is considered for a future development. The method guarantees solution convergence.
REFERENCES
1. Researchers warn of a threat to water safety from wildfires. Science Daily. 2025.
2. Whelton AJ, Seidel C, Wham BP, Fischer EC, Isaacson K, Jankowski C, et al. The Marshall Fire: Scientific and Policy Needs for Water System Disaster Response. AWWA Water Science. 2023; 5: e1218.
3. Solomon GM, Hurley S, Carpenter C, Young TM, English P, Reynolods P. Fire and Water: Assessing Drinking Water Contamination after a Major Wildfire. ACS EST Water. 2021; 1: 1878-1886.
4. Meadows R. FEATURE: How Wildfire-damaged Plastic Pipes Contaminate Drinking water – and What We Can Do about It. MAVEN’S NOTEBOOK. 2022.
5. Richter EG, Fischer EC, Metz A, Wham BP. Simulation of Heat Transfer Through Soil for the Investigation of Wildfire Impacts on Buried Pipelines. Fire Technology. 2022; 58: 1889-1915.
6. Fischer EC, Wham BP, Metz A. Contaminant Migration from Polymer Pipes to Drinking Water under High Temperature Wildfire Exposure. Lifelines 2022. 2022.
7. Metz AJ, Fischer EC, Wham BP. Behavior of Service Lateral Pipes during Wildfires: Testing Methodologies and Impact on Drinking Water Contamination. ACS ES&T Water. 2023; 3: 275-286.
8. Pierce G, Roquemore P, Kearns F. Wildfire & water supply in California. 2021.
9. To Mitigate Impact of Wildfires on Communities’ Water, Report Fill Gaps in Guidance to Public Drinking Water System Staff. Lyles School of Civil and Construction Engineering – Purdue University. 2025.
10. Dantsker A, Brito J. Leak Location Detection in Underground Pipeline Using Transient Pollutant Propagation Concentration Signature Analysis with Theory of Hypernumbers. Research & Reviews: Discrete Mathematical Structure. 2025; 12: 13-22.
11. Burgin M. Nonlinear partial differential equations in extrafunctions. Integr Math Theory App. 2010; 2: 17-50.
12. Burgin M. Hypernumbers and extrafunctions: extending the classical calculus. Springer. 2012.
13. Burgin M, Dantsker AM. A method of solving operator equations by means of the theory of hypernumbers. Not Nat Acad Sci Ukr. 1995; 8: 27-30.
14. Burgin M, Dantsker A. Pollution information acquisition and discovering pollution sources. Journals Proceedings. 2022; 81: 74.
15. Dantsker A, Burgin M. Monitoring Thermal Conditions and Finding Sources of Overheating. Proceedings. 2022; 81: 38.
16. Kolmogorov AN. “On the analytic methods of probability theory”. Uspekhi Mat Nauk. 1938; 5: 5-41.
17. Issacson KP, Proctor CR, Wang QE, Edwards EY, Noh Y, Shah AD, et al. Drinking water contamination from the thermal degradation of plastics: implications for wildfire and structure fire response. Environmental Science: Water Research & Technology. 2021; 7: 274-284.
18. Proctor CR, Lee J, Yu D, Shah AD, Whelton AJ. Wildfire caused widespread drinking water distribution network contamination. AWW Water Science. 2020; 2: e1183.