Research Article | Volume 1 - Issue 1 | Article DOI : https://dx.doi.org/10.36876/aamb.1006
Download PDF
Ana I Lopes, Freni K Tavaria* and Manuela E Pintado
Centro de Biotecnologia e Química Fina, Universidade Católica Portuguesa/Porto, Portugal
Corresponding Author:
Freni Kekhasharú Tavaria, Centro de Biotecnologia e Química Fina - Laboratório Associado, Escola Superior de Biotecnologia, Universidade Católica Portuguesa/Porto, Rua Arquiteto Lobão Vital, 4202-401 Porto, Portugal, Tel: 351-22-5580001, Ext. 1433;
Keywords
Dermatophytes;
Dermatophytosis; Chitosan; Anti-fungal
activity
Abstract
Dermatophytes are a group of fungi that can invade keratinized tissues of humans and other animals and produce an infection called Dermatophytosis. As chitosan possesses antimicrobial activity, it can potentially be used to treat dermatophytic infections. The main objective of this work was therefore, to evaluate the antifungal activity of chitosan upon some dermatophytes, namely Microsporum canis and Trychophyton rubrum. In view of this, Minimum Inhibitory (MICs) and Minimum Fungicidal Concentrations (MFCs) of chitosans upon the fungi were determined. Moreover, in order to understand the effect of chitosan on fungal activity, hair was infected with these fungi in the presence and absence of chitosan and Scanning Electron Microscopy (SEM) images were obtained and analyzed. Lastly, keratin-azure was used as substrate to evaluate the effect of chitosan on keratin degradation by M. canis and T. rubrum. The results showed that chitosan possesses antifungal activity against T. rubrum and M. canis, presenting MICs and MFCs ranging from 1.1 to 2.2 mg/mL. The antifungal activity of chitosan is concentration dependent. The analysis of SEM images of hair infected with these dermatophytes revealed that chitosan seems to have a protective effect on the hair, reducing the extent of damage when compared to the control. Chitosan also displayed important activity in preventing proteases’ action and in preventing hair damage. Based on the obtained results, it’s possible to conclude that chitosan showed relevant antifungal activity against dermatophytes, which opens good prospects to the use of chitosan as an alternative for the conventional fungal treatments.
Introduction
Dermatophytes are a group of fungi with the ability to invade keratinized tissues of humans and other animals and produce an infection called Dermatophytosis [1].These fungi are classified in three anamorphic genera, Epidermophyton, Microsporum and Trichophyton [2].
Dermatophytosis is the most common fungal infections worldwide, affecting millions of people annually.Conventional treatments consist on oral and topical antifungals.The topical antifungals should penetrate the skin and remain there in order to suppress fungal growth [4].Sometimes, oral antifungals are required as it is verified for Tinea unguim and Tinea capitis cases.
However, the control of dermatophytic infections requires prolonged therapy, and the existing drugs used for long periods seem to exhibit side effects [5].Besides that, some studies suggest that a 4-week treatment with terbinafine is insufficient for Microsporum infections [6]. Additionally,some of these drugs have been showing growing resistances as in the case of terbinafine [7], fluconazole, itraconazole, amphotericin B, griseofulvin [8], among others.Thus, there is a demand for new drug formulations for long-term use that are biocompatible, without side effects and resistances.
Chitosan as a natural antifungal agent could be an alternative to traditional treatments. It is a cationic polysaccharide composed of β-1,4 linked D-glucosamine and N-acetyl-D- glucosamine residues [9] and only occurs naturally in some fungi (Mucoraceae).This polymer has proved to be non-toxic, biodegradable, biocompatible, and to possess several biological properties, including an antimicrobial activity [10].
However, there are only a few studies focusing on the efficiency of chitosan in dermatophytes and those studies only refer to the determination of chitosan Minimum Inhibitory Concentrations (MICs).So, the main aim of this work was to evaluate the antifungal activity of high,medium and low molecular weight chitosans upon some dermatophytes as well as to demonstrate chitosan’s efficacy on the inhibition of some virulence factors produced by these fungi during infection.
Materials and Methods
Test organisms and media
Microsporum canis (M. canis) (CCUG 35347) and Tricophyton rubrum (T. rubrum) (CCUG 36833) cultures were obtained from Göteborg University (CCUG) (Sweden).Both fungi were grown on Dermatophyte Test Medium [DTM: Sabouraud dextrose agar with 0.055% L(+) tartaric acid (Sigma, St. Louis, MO, USA),cycloheximide (0.4 g/L, Sigma), chloramphenicol (0.05 g/L, Sigma) and 0.2 g/L phenol red] for 14 d at 30°C.
Chitosan preparation
High, medium and low Molecular Weight chitosans (MW) were obtained from Sigma-Aldrich.High Molecular Weight (HMW) chitosan presented a Deacetylation Degree (DD) > 75% and a MW of 624 kDa; Medium Molecular Weight (MMW) chitosan presented a DD between 75 and 85% and a MW of 591 kDa; Low Molecular Weight (LMW) chitosan presented a DD between 75 and 85% and a MW of 107 kDa.
Chitosan powders were dissolved in a 0.5% (v/v) acetic acid solution and left stirring overnight until it had a gel-like consistency.Then, the pH was adjusted to 5.6 with 5 M NaOH and autoclaved at 120°C for 15 min.
Determination of minimum inhibitory concentration by microdilution method
The three chitosans were tested against M. canis and T. rubrum. In order to determine MICs of the chitosans, the method described by Galupi et al.[11] was used with some modifications. Inocula were prepared by covering the cultures grown in DTM agar with 0.1% tween 20 (Sigma) solution and the colonies gently scraped from the surface with the tip of a glass Pasteur pipette. Spores in the inocula were counted with a Neubauer chamber and the concentration was adjusted to 106 spores/mL.After that, the chitosan solutions were diluted in DTM.Five different dilutions of each chitosan ranging from 8.75 to 0.1 mg/mL were made and all of them were added in triplicate to a 96-well microplate.The chitosan concentrations tested are indicated in Table 1.
Table 1: Concentrations of chitosan used in the microdilution test.
| Concentrations of chitosan tested (mg/mL) |
| |
Trichophyton rubrum |
Microsporum canis |
| High molecular weight |
5.0-0.3125 |
5.0-0.3125 |
| Medium molecular weight |
6.25-0.39 |
6.25-0.39 |
| Low molecular weight |
8.75-0.55 |
2.2-0.1 |
A positive control and a negative control were used. Additionally, chitosan solutions alone (to control sterility) and acetic acid with medium and inoculum were also used as additional controls.The microplates were incubated at 25°C for 14 d.The MIC was defined as the lowest concentration where no growth was observed.MFCs were determined by inoculating DTM plates with 100 µL of sample from the wells where no growth was observed.These were incubated at 30°C during 14 d. MFC was defined as the lowest concentration in which no visible growth was observed.
Hair infection-Scanning Electron Microscopy
Preparation of conidia and infection of human hair: T. rubrum and M. canis were cultured on DTM agar for 14 d.The inocula were prepared as described above with the spore concentration adjusted to 106 spores/mL.Human hair was obtained in a hairdresser and cut into 2 cm long pieces,washed and sterilized with a chloroform-ethanol 1:1 solution at room temperature for 2 h as suggested by Kanbe and Tanaka [12]. Five treatments were prepared in sterilized tubes all of them containing 50 mg of hair: negative and positive controls and treatments with the 3 types of chitosan.The negative control included 20 mL of KH2 PO4 buffer; chitosan treatments included buffer and previously determined sub-MICs for each fungus and type of chitosan - 0.6 mg/mL of HMW chitosan; 0.08 mg/mL MMW chitosan for both fungi, and 1.1 mg/mL LMW chitosan for T. rubrum and 0.6 mg/mL for M. canis. Then, 200 µL of the spore suspension was added to each tube except for the negative control tubes.
Two replicates for each fungus, treatment and sampling time were prepared and incubated in a shaker incubator at 80 rpm (27°C). Hair infected with each fungus was collected after 1,2 and 3 weeks of incubation and observed by Scanning Electron Microscopy (SEM).
Scanning electron microscopy
The specimens were fixed in 2.5% glutaraldehyde in 0.1 M sodium cacodylate buffer (pH 7.2-7.3), overnight.Then, the fixed sections were rinsed three times in cacodylate buffer solution (pH 7.3) for 10 min and dried in a graded ethanol series, e.g. 10, 30, 50, 70, 80, 90 and 100%, 15 min.The samples were mounted onto cover slips and coated with gold, after which they were observed in a scanning electron microscope (Jeol 5600LV, Tokyo, Japan) operated at 20kV.
Keratin degradation test
Low, medium and high MW chitosans were added to sterilized, basal medium (BM, as described in Scott and Untereiner [13]) at 1.1 mg/mL, 0.8 mg/mL and 0.6 mg/mL,respectively for T. rubrum and 0.6 mg/mL, 0.8 mg/mL and 0.6 mg/mL for M. canis in tubes. Finely chopped keratin azure was suspended to a concentration of 4 mg/mL in basal medium, autoclaved and added aseptically into each tube (1 mL overlay).
The tubes were incubated at 25°C and observations were made after 1, 2 and 4 weeks of incubation. Controls included a negative control and a positive control.
In plates containing DTM and chitosan,3 pieces of keratin azure were distributed and inoculated with 100 µL of the fungal suspension.After 4 weeks of incubation, a small piece of keratin azure with the fungus from each plate was placed in a glass slide and stained with lactophenol cotton blue for observation of the fungal structures.The samples were observed in an optical microscope (400x).
Results
Determination of chitosan antifungal activity MIC
determination by microdilution method:The MICs of high, medium and low MW chitosans towards T.rubrum and M. canis were determined and are presented in Table 2.The MICs values were the same for HMW (1.3 mg/mL) and MMW (1.6 mg/mL) chitosans for both T.rubrum and M. canis.With LMW chitosan, significant differences were observed for both fungi, where T.rubrum required twice as much chitosan to be inhibited when compared to M. canis.So, the chitosan that showed the best inhibitory effect for M. canis was the LMW chitosan (1.1 mg/mL) whereas high HMW chitosan was the chitosan with the best inhibitory effect towards T. rubrum.
Table 2: Minimum inhibitory concentration and minimum fungicidal concentration of HMW, MMW and LMW chitosans for Trichophyton rubrum and Microsporum canis.
| |
Trichophyton rubrum |
Microsporum canis |
| |
MIC (mg/mL) |
MFC (mg/mL) |
MIC (mg/mL) |
MFC (mg/mL) |
| High molecular weight chitosan |
1.3 |
1.3 |
1.3 |
1.3 |
| Medium molecular weight chitosan |
1.6 |
1.6 |
1.6 |
1.6 |
| Low molecular weight chitosan |
2.2 |
2.2 |
1.1 |
1.1 |
Minimum Fungicidal Concentration (MFC) determination: Besides MICs determination, MFCs were also determined for T.rubrum and M. canis (Table 2).MFC values of 1.3 mg/mL for HMW chitosan for both fungi,1.6 mg/mL for MMH chitosan for both fungi and 2.2 mg/mL for LMW chitosan for T.rubrum and 1.1 mg/mL for LMW chitosan for M.canis were found to be the same as the MIC values for both fungi.To the best of our knowledge, previous studies with chitosan and dermatophytes did not refer to the determination of MFC.
Inhibition of keratinolytic activity in hair model
Samples were collected after one, two and three weeks of incubation and submitted to SEM analysis.Through this analysis, it was possible to see the morphological changes occurring when hair was infected with dermatophytes.
In Figures 1 and 2,images of hair infected with T.rubrum and M.canis, respectively and treated with the tested chitosans can be observed.

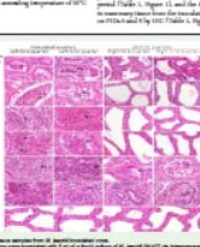
Figure 1: Scanning electron microscopy pictures of human hair infected with T.rubrum and treated with HMW(E,F),MMW(G,H) and LMW(I,J) chitosans for 1 and 3 weeks,respectively.Negative controls (A,B) and positive controls (C,D) are also shown.Magnification:A,B,E,F,G,I,J -400x;C–550x;D,H–500x.In the various pictures,*indicates a chitosan deposition and the arrows are pointing to peeled cells and abnormalities in the hair.

Figure 2: Scanning electron microscopy pictures of human hair infected with M. canis and treated with HMW (E,F), MMW (G,H) and LMW (I,J) chitosans for 1 and 3 weeks,respectively.Negative controls (A,B) and positive controls (C,D) are also shown.Magnification:A,B,C,E–400x;G,I–370x;H,J–300x;D,F-600x.In the various pictures:*indicates a chitosan deposition, structures with a circle around them are “holes” in the air and the arrows are pointing to peeled cells and abnormalities in the hair.
Several stages of infection can be observed in the positive control images confirming the infection progress for each fungus.
In the case of T.rubrum, after one week of incubation (Figure 1C),the hair still showed normal appearance.Damage caused by the fungus was minimal as the hair presented only a few abnormalities.In the second week of incubation,the regularity of the cuticle was altered in some areas and the hair seems to be bumpy.Finally,after three weeks of incubation, the hair was completely destroyed.
In the case of HMW chitosan treatment, after one week of incubation (Figure 1E),no degradation was apparent.The precipitate like structures arranged in the uppermost layer of the hair do not seem to be fungal structures,but precipitated chitosan.The same pattern is visible in the second week of incubation.After 3 weeks of incubation, the hair showed evidence of damage on the surface,however very reduced in extension when compared with the positive control.
In the MMW chitosan treatment, after one week of incubation, the hair looked normal and the only abnormality observed were darker spots resembling holes.The hair also presented chitosan precipitates.In the second week of the experience, the hair showed a few more holes and very few cuticle cells were raised.At the third week of incubation, the hair was only slightly degraded when compared with the positive control for the same time period.
In the first week of incubation,LMW chitosan-treated hair presented a structure that resembled a protection film on the surface.After two weeks of incubation,a few holes were visible, with a slight abnormal pattern of the cuticular cells. At the end of experience, the hair showed damage signs in particular some holes and raised peeled cells but in smaller extension; the existence of chitosan precipitation is also evident.
In samples infected with M. canis, only after one week of incubation (Figure 2C), the hair already showed visible signs of damage since an abnormal pattern of the cuticular cells was clearly visible.In the second week of incubation, spores and hyphae were visible on the cuticular layer and the fungus destroyed the upper layers of the hair. At the end of the experimental time, the hair was greatly disintegrated confirming the infection progress.
In the case of HMW chitosan treatment, at the end of the first week (Figure 2E), the hair showed a normal appearance.After two weeks of incubation, a similar result was observed. At the last week of the experiment (Figure 2F), chitosan precipitates were evident, but, this time, a shadow as a hole can be observed suggesting slight fungal activity.
For MMW chitosan treatment, after one week of incubation (Figure 2G),despite the treatment with chitosan, M.canis was able to form fungal structures. Alongside with the presence of chitosan precipitates, cuticle cells of the hair were slightly raised and few of them were peeled off. Very few holes were also visible. After two weeks of incubation, the hair presented perforating organs that were larger in size. Chitosan precipitates could also be observed. After three weeks of incubation (Figure 2H) the hair was quite damaged, the regularity of the cuticle was altered in some areas and the fungus started to invade inner layers. However, the effect of M. canis infection was quite delayed and reduced when compared with the control.
In the case of LMW chitosan treatment, in the first week of incubation, the hair did not show any sign of fungal infection and it’s possible to observe precipitates in the uppermost layers (Figure 2I). After two weeks, fungal spores were visible on the cuticle and very few perforating organs and chitosan precipitates could also be observed. At the end of the experiment, the hair seemed to be covered by a chitosan film with precipitates that may protect it from fungal invasion.
Based on these results, it is evident that chitosan can efficiently reduce the effects of a dermatophyte infection in human hair, since the hair was less damaged. However, HMW chitosan showed to be the most efficient in preventing hair degradation by both fungi.
Effect of chitosan on virulence factors
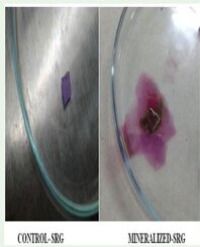
Keratin degradation test: In this test, keratin-azure was used as the only protein source in the medium. Keratin-azure is a blue compound that becomes colourless upon cleavage [16]. When degraded by keratinolytic fungi, the blue dye is released into the culture medium.The migration of the azure dye is a measure of the keratin degradation ability by the keratinolytic fungi. Chitosan present in the culture medium is expected to lower the azure dye release into the medium. Samples with T.rubrum did not show dye release in any of the treatments with chitosan and presented a weak release in the positive control. However,M.canis showed an abundant dye release in the positive control tube because it produces perforating bodies. M. canis presented dye release in chitosan-containing tubes, but this effect was weaker than that observed in the positive control, with shorter migration of the azure dye. No dye release or fungal growth was observed in the negative controls.
Because M. canis showed a different dye release when exposed to the three types of chitosans, the distance travelled by the dye released from the keratin was measured after one, two and four weeks of incubation (Figure 3).

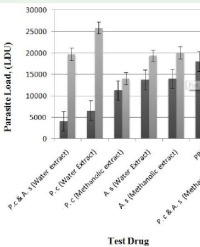
Figure 3: Azure dye release (distance moved in cm) during 4 weeks for M. canis.
An increase in the migration of azure dye could be seen in the positive control, directly proportional to the incubation time corresponding to a linear relation (R2= 0.99) between the displacement of azure dye (ca. 1.5 cm) with the degradation rate (0.5,assuming as the slope).The azure dye released is probably dependent on the growth and maturity of the fungus.Thus, at longer incubation times, more azure dye will be released.It is apparent that chitosan interfered with keratin degradation. All chitosans tested were able to prevent keratin degradation, since the distance travelled by the released dye liberated at the end of the experiment time is approximately the same as observed in the positive control after one week of incubation (0.3-0.4 cm).
The displacement of azure dye release with HMW chitosan treatment only slightly increased during the incubation time up to a maximum of 0.3 cm after four weeks of incubation, that corresponds to a linear relation (R2= 0.96) between the incubation time and the displacement of azure dye presenting a rate of degradation of ca. 0.10. On the other hand, for the MMW chitosan, the migration of azure dye increase up to 0.35 cm, after one week of incubation but remained constant until the end of incubation time. Regarding LMW chitosan treatment, the migration of azure dye increase linearly up to 0.45 cm by two weeks of incubation (presenting similar values as control for one week) but remained constant until the end of incubation time.
Although it is apparent that MMW chitosan seems to be the less efficient chitosan in preventing keratin degradation, since the initial rate is higher, in fact all the chitosans led to similar and significant inhibition of migration (corresponding to inhibition of keratin degradation) after 4 weeks of incubation when compared with control, corresponding to a reduction of 70-77% of azure dye displacement.So, all MW chitosans seem to be equally efficient in preventing keratin degradation by M.canis.
Keratin degradation test-microscopic analysis: In order to verify the existence of a relationship between the analytical data and the events at a microscopic level, keratin-azure samples of each treatment for both T. rubrum and M. canis were observed by SEM and optical microscope.
The following Figures 4 and 5 show keratin-azure threads infected with both fungi and treated with chitosan. Positive control and negative control images are also depicted for both fungi.

Figure 4: Optical and scanning electron microscopy pictures of keratin-azure threads infected with T. rubrum and treated MMW chitosan. Magnification: A, B- 100x; C- 400x; D – 900x; E – 1000x; F – 850x.

Figure 5: Optical and scanning electron microscopy pictures of keratin azure threads infected with M. canis and treated with MMW chitosan. Magnification: A - 100x; B, C- 400x; D – 900x; E, F –850x.
For T. rubrum, the positive control observed by optical microscopy shows fungal hyphae around the keratin-azure fibre, but no signs of fungal destruction were evident. However, analysis of SEM images allowed the observation of some holes in the fibre surface. No other sign of fungal infection was visible. In MMW chitosan treatment (Figure 4C), the fungus it´s located on the top and around the keratin-azure fiber not causing any visible damage. With HMW chitosan (results not shown) the fungus seems to organize itself around and on the top of the keratin-azure not causing the fiber’s degradation. This is even more remarkable in SEM image as it´s possible to observe some fungal spores on the keratin-azure fiber. Additionally, the number of holes caused by the fungus is lower than that observed in the positive control.
In the case of M. canis, large masses of fungal mycelium could be observed for the positive control (Figure 5B), which was quite different from the negative control. These differences were even more apparent in SEM images where severe damage of the fibres, including holes, can be observed. In the MMW chitosan treatment, it is possible to observe some fungal hyphae and spores (Figure 5C). They are located on top and around the keratin- azure, but no sign of degradation is visible. In the SEM image (Figure 5F), an intact keratin-azure fiber with fungal spores on the top was observed.
Discussion
It is believed that chitosan’s cationic nature and high molecular mass helps in its antifungal action, since it interferes with negatively charged residues of macromolecules on the fungal cell surface, thus causing changes in cell membrane permeability [17,18]. It can also prevent DNA transcription to RNA [15].
Some authors [15] mention that antifungal activity of chitosan is MW dependent and that LMW results in stronger antifungal activity. In this work, this relation was only verified for M. canis, while for T. rubrum this was not the case, since HMW chitosan showed smaller MICs. These results can be explained by the fact that antifungal activity is dependent on the fungi; these can interfere with antifungal activity of a drug due to its adaptation and defense mechanisms to stress, affecting the structural integrity of the cell wall or inducing the synthesis of defense compounds [19].
Other authors refer that inhibitory action of chitosan is directly proportional to the concentration because at higher concentrations of chitosan, fungi will produce higher concentrations of chitinase and this leads to the degradation of chitin and chitosan of fungal cell walls [15]. Additionally, chitosan also possesses the ability to prevent spore germination. In fact, chitosan can interfere with the uptake of minerals, particularly Ca2+ and nutrients, thereby delaying the spore germination process [20].
Therefore, the antifungal activity of chitosan against T. rubrum and M. canis was proven. Balicka-Ramisz et al. [21] also studied chitosan antifungal activity upon dermatophytes. They obtained a MIC value of 1.1 mg/mL for M. canis using chitosan with a DD degree greater than 80% and a MW in the range of 4.0 × 10⁵ to 5.0 × 10⁵, corroborating the MIC value obtained in this study for LMW chitosan for the mentioned fungus. These authors also determined the MIC of chitosan for another dermatophyte fungus, T. mentagrophytes and reached the value of 2.2 mg/mL. Although MIC values for this species were not determined in this study, the MIC value obtained by these authors for this fungus is the same as the one determined in this work for T. rubrum when treated with LMW chitosan; and although the DD degree of the chitosan used was very similar to the DD degree used in this work, the MW is quite different. However, the MIC values obtained in this work for LMW chitosan were the same.
When chitosan is not at least at MICs, lower concentrations cannot completely inhibit fungal growth, but could inhibit some of the virulence factors like keratinolytic enzymes and prevent the infection or control its progression. Samples infected with T. rubrum and M. canis were degraded by these fungi but presented some differences according to the infectious agent. These ultra structural differences of the hair when infected with different dermatophytes could be explained by differences in keratin degradation. In fact, T. rubrum causes flat erosions of the hair surface [22], while M. canis produces radial penetration [14]. These different processes during hair infection may help explain why the hair infected by T. rubrum seems to be less degraded, since flat erosion is a gradual form of hair destruction unlike radial penetration.
Hair samples infected with fungus and treated with chitosan were evaluated for the first time in this work. Although some authors reported the stages of infection of the hair when infected with dermatophytes, no antifungal treatment was applied to the hair until now. The antifungal effect of chitosan upon virulence factors production was studied through a keratin degradation test. T. rubrum presented a weak release in the positive control tube, probably because this fungus does not produce perforating bodies. According to Scott and Untereiner [13], T. rubrum cannot degrade keratin-azure and release the azure dye into the culture medium. On the contrary, M. canis showed an abundant dye release in the positive control tube because it produces perforating bodies. Scott and Untereiner [13] also mentioned that the density of growth did not appear to be correlated with the degree of dye release. In the present study, this fact was also verified because T. rubrum presented substantial growth but the dye release was very weak or even absent, while Microsporum canis, showed abundant growth with significant dye release.
To conclude, the results of this study suggest that chitosan as natural antimicrobial can potentially be used with success as an alternative or adjuvant to conventional treatments of dermatophytes.
Funding Information
The authors gratefully acknowledge the financial support through project Biotherapies-Bioengineered Therapies for Infectious Diseases and Tissue Regeneration, North Regional Operational Program, Norte 2020. (NORTE-01-0145-Feder-000012). We would also like to thank the scientific collaboration of CBQF under the FCT project UID/Multi/50016/2013.
References
1. Weitzman I, Summerbell RC. The dermatophytes. Clin Microbiol Rev. 1995; 8: 240-259.
2. Wagner DK, Sohnle PG. Cutaneous defenses against dermatophytes and yeasts. Clin Microbiol Rev. 1995; 8: 317-335.
3. White TC, Oliver BG, Graser Y, Henn MR. Generating and testing molecular hypotheses in dermatohytes. Eukaryot Cell. 2008; 7: 1238-1245.
4. Del Palacio A, Garau M, Gonzalez-Escalada A, Calvo MT. Trends in treatment of dermatophytosis. Biology of dermatophytes and other keratinophilic fungi. Rev Iberoam Micol. 2000; 148-158.
5. Subha TS, Gnanamani A. In vitro assessment of anti-dermatophytic effect of active fraction of methanolic extracts of Acorus calamus. J Anim Plant Sci. 2009; 5: 450-455.
6. Devliotou-Panagiotidou D, Koussidou-Eremondi TH. Efficacy and tolerability of 8 weeks’ treatment with terbinafine in children with tinea capitis caused by Microsporum canis: a comparison of three doses. J Eur Acad Dermatol Venereol. 2004; 18: 155-159.
7. Mukherjee PK, Leidich SD, Isham N, Leitner I, Ryder NS, Ghannoum MA. Clinical Trichophyton rubrum strain exhibiting primary resistance to terbinafine. Antimicrob Agents Chemother. 2003; 47: 82-86.
8. Martinez-Rossi NM, Peres NT, Rossi A. Antifungal resistance mechanisms in dermatophytes. Mycopathologia 2008; 166: 369-383.
9. Meng X, Xing R, Liu S, Yu H, Li K, Qin Y, et al. Molecular weight and pH effects of aminoethyl modified chitosan on antibacterial activity in vitro. Int J Biol Macromol. 2012; 50: 918-924.
10. Aranaz I, Mengíbar M, Harris R, Paños I. Functional characterization of chitn and chitosan. Curr Chem Biol. 2009; 3: 203-230.
11. Galuppi R, Gambarara A, Bonoli C, Ostanello F, Tampieri MP. Antimycotic effectiveness against dermatophytes: comparison of two in vitro tests. Vet Res Commun. 2010; 34: S57-S61.
12. Kanbe T, Tanaka K. Ultrastructure of the invasion of human hair in vitro by the keratinophilic fungus Microsporum gypseum. Infect Immun. 1982; 38: 706-715.
13. Scott JA, Untereiner WA. Determination of keratin degradation by fungi using keratin azure. Med Mycol. 2004; 42: 239-246.
14. Marchisio VF. Keratinophilic fungi: Their role in nature and degradation of keratinic substrates. In: Kushwaha RKS, Guarro J (Eds.). Biology of Dermatophytes and other Keratinophilic Fungi. Rev Iberoam Micol. Bilbao, 2000; 86-92.
15. Li XF, Feng XQ, Yang S, Wang TP, Su ZX. Effects of molecular weight and concentration of chitosan on antifungal activity against Aspergillus niger. Iran Polym J. 2008; 17: 843-852.
16. Sharma R, Rajak RC. Keratinophilic Fungi: Nature’s Keratin Degrading Machines!. Resonance. 2003; 8: 28-40.
17. Di Piero RM, Garda MV. Chitosan reduces the anthracnose severity and increases the glucanase activity in common bean plants. Pesq Agropec Bras. 2008; 43: 1121-1128.
18. Coqueiro DSO, Di Piero RM. Activity of chitosan with different molecular weights on Alternaria solani. Arq Inst Biol. 2011; 78: 459- 463.
19. Sajomsang W, Gonil P, Saesoo S, Ovatlarnporn C. Antifungal property of quaternized chitosan and its derivatives. Int J Biol Macromol. 2012; 50: 263 269.
20. Plascencia-Jatomea M, Viniegra G, Olayo R, Castillo-Ortega MM. Effect of chitosan and temperature on spore germination of Aspergillus niger. Macromol Biosci. 2003; 3: 582-586.
21. Balicka-Ramisz A, Wojtasz-Pajak A, Pilarczyk B, Ramisz A. Antibacterial and antifungal activity of chitosan. ISAH 2005; 2: 406-408.
22. Katiar F, Kushwaha RKS. Human hair perforating ability of Chrysosporium tropicum strains. Int J Pharm Biol Arch. 2012; 3: 1260-1264.
Citation
Lopes AI, Tavaria FK and Pintado ME. Application of Chitosan in the Control of Fungal Infections by Dermatophytes. Ann Appl Microbiol
Biotechnol J. 2017; 1(1): 1006.