Research Article | Volume 8 - Issue 1 | Article DOI :
Download PDF
Kaiyi Fan1*, Mengze Wang2,3, Jun Yao2, Bo Ma2, Ning Min2 and Tatyana Kouznetsova3
1Inner Mongolia Agricultural University, China
2School of Water Resources and Environment, China University of Geosciences (Beijing), China
3Institute of General and Inorganic Chemistry of National Academy of Sciences of Belarus (IGIC NASB), Belarus
Corresponding Author:
Kaiyi Fan, Inner Mongolia Agricultural University, 306 Zhaowuda Road, Saihan District, 010018, Hohhot City, Inner Mongolia, China
Keywords
Microbial Biomass C; Enzyme Activity; Microbial Quotient; Microbial Metabolic Quotient; Biolog; Phospholipids Fatty Acid.
Abstract
Soil contamination by copper (Cu) causes a severe loss of crop production in China due to rapid industrialization. A laboratory
incubation experiment with varied levels of Cu was conducted to study toxic effects of Cu contamination on microbiological properties
of Irrigation silt soil. Basal respiration (BR), microbial biomass C (Cmic), and microbial quotient (MQ) were stimulated low levels of
external Cu loadings (<50 mg kg-1), but were inhibited at higher rates (>400 mg kg-1). Microbial metabolic quotient (MMQ) was
significantly enhanced. Increasing Cu loading decreased enzyme activities, by 65.6% for phosphatase, 99.5% for invertase, and
74.7% for urease. Color development rate and richness were accelerated, and Shannon diversity and Shannon evenness increased
at low levels of external Cu loadings (<50 mg kg-1), but the reverse was true at higher Cu rate (400 mg kg-1), as estimated by the
Biolog procedure. External Cu loading affected the amounts of individual fatty acids and their ratios. The saturated fatty acids were
increased by 144% and 74%, respectively at the rates of 100 and 400 mg kg-1 Cu, as compared to the control. Gram negative
bacteria were increased by 10.1% and 20.6%, and actinomycete by 10% and 8% respectively, whereas fungi were decreased
11.8% and 66.1%, respectively at the loading rates of 100 and 400 mg kg-1 Cu. These results indicate that microbial biomass, basal
respiration rate, and enzyme activities and microbial community structure in the Irrigation silt soil are sensitive to Cu contamination
and can serve as indicators of Cu contamination.
INTRODUCTION
Metals enter the environment through industrial activities, such as mining and smelting as well as agricultural management, including application of pesticides, fertilizers. Metals remain in soils for extremely long periods, and hard to biodegrading [1]. For these reasons, remediation of metal contaminated soils offers unique challenges. Metal contamination of soil is a significant environmental issue in China recent years as a result of the rapid industrialization.
Due to their function and ubiquitous presence micro-organisms can act as an environmentally very relevant indicator of pollution. In recent years, more studies have focused on microbiological response to metal contamination, on the belief that microorganisms, being simple in structure and habited in soil, are more sensitive than plants when subjected to the stress of excessive metals. Some features of soil microorganisms, such as the microbial biomass size and soil enzyme activity, are often used as bioindicators for the ecotoxicity of metal pollution [2]. It is known that metal contamination lessens soil respiration [3], microbial biomass [4], soil enzyme activities [5], and microbial numbers [6]. Brookes et al, [2] suggested that the ratio of basal respiration rate (BR) to microbial biomass C(Cmic), or Cmic as a percentage of soil organic C, might be better indicators of soil pollution than either microbial activity or biomass measurements alone. This is because both properties relate to the living fraction of soil organic matter and one can hardly exist without the other. Anderson and Domsch et al. [7], suggested the ratio of microbial activity to microbial biomass is termed ‘microbial metabolic quotient’(MMQ) and used it to assess the process of soil degradation. In addition, because of the redundancy of function within soil microbial communities, some researchers have suggested that measures of microbial community diversity or microbial population structure may be more sensitive as indicators of changes in soil quality than assays which focus on general microbial processes or overall community size. There are two techniques which are being applied to studies of microbial community structure, the BIOLOG assay and the phospholipids fatty acid (PLFA) assay.
The effects of metal contamination on the size and activity of soil microbial communities have been well documented [2-10]. However, little is known about the toxic effect of Cu on microbial biomass, microbial activity, and the structure of microbial community in Irrigation silt soil, which is widespread in irrigated area of Northern China. Unfortunately, an increasing portion of the Irrigation silt field is contaminated by Cu and other metals due to rapid industrialization in this region.
Efforts are made to predict detrimental effects of Cu pollution based on some sensitive and reliable indicators and remediate the degraded soil accordingly. Soil microbiological parameters were selected to provide insight into the impact of Cu loading upon Irrigation silt soil ecological functions mainly because the soil microflora plays an essential role in maintaining soil fertility, nutrients cycling and the organic carbon decomposing. The objectives of this study were: 1) to measure microbiological responses of Cu pollution in Irrigation silt soil; 2) to evaluate the potential of using some sensitive microbial indicators for predicting Cu contamination at an early stage.
MATERIALS AND METHODS
Soil
1. Soil samples were randomly collected at 0-20 cm depth from an Irrigation silt field in Saraqi Town, Tumote Right County, Baotou City, Inner Mongolia. The soil was silt loam named anthropogenic-alluvial soil. After removing visible plant materials, stones, and soil fauna, part of the soil was sieved (< 2 mm) and stored in plastic bags at 4 ˚C in a refrigerator, and the remaining sample was air dried, ground to <2 mm particle size for basic soil properties test (Table 1).
Table 1: Soil physical and chemical properties of SLS used in this study
|
Soil type
|
Sand
|
Silt
|
Clay
|
pH(H20/
Soil=5/1
|
O.M
g kg-1
|
CEC
Cmol kg-1
|
Total Cu
|
Extractable Cu
|
|
%
|
mg kg-1
|
|
Ultisol
|
59.6
|
29.3
|
11.1
|
8.34
|
11.25
|
8.42
|
18.25
|
2.32
|
Soil pH was determined using a pH meter at 1: 5 soil: water ratio, whereas soil particle distribution was measures by the Pipette Method [11]. Organic carbon, total and DTPA extractable copper and other soil properties were measured according to Page et al., [12]. Laboratory incubation experiment
Portions of moist soil (1 kg oven-dry basis) were each placed in a glass vessel and treated with a CuNO3 · 3H2 O aqueous solution to reach the following external loadings: 0, 50, 100, 200, 400, 800, 1200, 1600 mg Cu²+ kg-1 soil. Deionized water was sprayed evenly to adjust soil moisture to 70% of water holding capacity. The treated soil samples were then incubated at 25˚C in the dark. Each treatment was replicated three times. At the end of 8-week incubation, subsamples of the soil were taken from the vessels for analysis chemical and microbiological properties in response to Cu treatments.
2. Measurements of chemical, biochemical, and microbiological properties
Urease activity was assayed by the buffer method of Tabatabai [13], which involves the determination of the NH4 +-N released when a soil sample is incubated with THAM buffer at the optimal pH (pH 9.0) with or without toluene, and urea (0.2 M) at 37˚C for 2h. When chloroform fumigation was used, urease activity was assayed within 1 h after removing the chloroform by evacuation.
Acid phosphatase activity (APA) was assayed by Hoffman’s method [14]. Ten mL of disodium phenyl phosphate solution (25 g/l) was used as a substrate and added to 5 g of soil sample. The soil samples were incubated for 12 h at 37˚C in pH 5.0 acetate buffer for APA determination. Five ml of buffer solution and 2 mL of the filtrate were transferred into a 100 mL volumetric flask, and dilute with deionized water to 25 mL, then 1 mL of 2,6-dibromoquinone-chlorimide solution was added and the samples were incubate for 30 min at room temperature. Finally, the samples were diluted to 100 ml using deionized water and the released phenol was colorimetrically measured at 578 nm. The APA was expressed as mg hydrolyzed phenol by 1 kg soil at 37oC per hour.
Invertase activity was measured following the methods of Ross et al, [15].
Microbial biomass C was determined by the fumigation–extraction method [16]. For each treatment soil, out of six subsamples (each containing 10 g fresh soil) three were fumigated with ethanol-free chloroform for 24 h. After removal of chloroform, the soil was extracted with 0.5 M K2 SO4 (using a soil:solution ratio of 1:4) by shaking for 30 min. The remaining three unfumigated soil samples were subjected to 0.5 m K2 SO4 extraction at the same time as the fumigated samples. The extracts were filtered through Whatman filter paper (No.42). The filtrates were analyzed for dissolved organic carbon using a TOC analyzer (TOC-500, Shimadzu, Japan).
Soil respiration was measured by placing 20 g of the incubated soil in a sealed flask and incubating for 24 h at 28oC. The CO2 evolved was trapped by 0.05 M NaOH, precipitated with 0.5 M BaCl2 , and then titrated with 0.05 M HCl using phenolphthalein as an indicator. The soil respiration was expressed as mg CO2 –C kg−1 soil per day.
The BIOLOG assay characterizes microbial communities based on their utilization of 95 different carbon substrates. The pattern of substrate utilization is known as the metabolic profile [17]. Microbial communities are inoculated onto BIOLOG plates and the plates are filled with bacterial suspensions of soil samples and substrate utilization is indicated by the coloration of the tetrazolium dye. In brief, fresh soil (10 g oven dry basis) was suspended in 90 ml of deionized water on a rotary shaker at 300 rev min -1 for 30 min. Suspensions were allowed to settle for 10 min before 10-fold dilution samples were prepared, resulting in a final dilution of 10 2 . Each well of BIOLOG ECO-plates was directly inoculated with 125μl of the diluted suspensions [18] and the plates were incubated at 20oC and absorbance at 595 nm was measured at time intervals using a BIOLOG Reader (Model 450; BioRad, Glattbrugg, Switzerland). The BIOLOG Reader recorded the optical density (OD) values for each of the 96 wells on each plate. Plates were read at the first sign of color development and read at 24 hour intervals up to 168 hours. Single well absorbance values from plates at similar average well color development (AWCD) were recorded, standardized by water blank subtraction and AWCD transformation [17].
PLFA profiles were determined using the method described by Zelles and Bai et al., [19], which is based on the one-phase extraction method. Lipid extracts were evaporated to dryness under a nitrogen atmosphere, re-dissolved in a small amount of chloroform, and separated into neutral lipids, glycolipids and phospholipids using an SPE-SI column (Varian, Harbor City, CA). Fatty acid methyl esters were prepared from the phospholipid fraction with mild alkaline methanolysis using toluene:methanol:0.2M KOH (0.5 ml:0.5 ml:5 ml). Nonadecanoic acid methyl ester was used as an internal standard. PLFAs were assayed using a gas chromatograph (GC) with a FID detector (HP6890; Hewlett Packard, Palo Alto, CA) and each fatty acid was identified with the Sherlock system ver. 4.0B (Microbial ID, Inc, Newark, Del.). The PLFA used in this analysis as follow (Table 2).
Table 2: PLFAs used in this study as bioindicators
|
Marker
|
Microbial group
|
|
12:0, 14:0, 15:0, 16:0, 17:0, 18;0, 19:0, 20:0
|
Saturated (bacteria in general)
|
|
14:0 iso, 15:0 anteiso, 15:0 iso, 15:0 iso 3OH, 16:0 iso, 17:0 anteiso, 17:0 iso
|
Gram-positive bacteria
|
|
15:1 iso G, 16:1 iso G, 16:1ω5c, ω7c,ω9c, 17:0 cy, 17;1 iso, 17:1ω8c, 17:1ω5c, 18:1 ω5c, 18:1ω9c, 19:0 cy ω10c, 19:0 cyω8c, 20:1ω9t or c all these may have OH groups
|
Gram-negative bacteria
|
|
TBSA 10 methyl 18:0, 16:0 10 methyl, 17:0 10 methyl
|
Actinomycete
|
|
18:2 ω6,9c, 18:3ω6, 18:3ω3
|
Fungi
|
(Note: Lowercase letters denote multiple comparison results. Same letters = no significant difference; different letters = significant difference at 5% level (P < 0.05))
Statistical analyses
Statistical analyses were performed using the SPSS statistical package and Excel 2011 program.
RESULTS
Response of Microbial activities to Cu loading
The response of microbial biomass C(Cmic ) to external Cu input varied from positive to negative, depending on the loading rate (Table 3).
Table 3: Microbial activities of Irrigation silt soil
|
Cu
mg/kg
|
Organic C
|
Cmic
|
BR
|
MQ
|
MMQ
|
|
g kg-1
|
mg kg-1
|
mg kg-1d-1
|
Cmic/Corg % d-1
|
qCO2/Cmic % d-1
|
|
0
|
11.53±0.55 a
|
147.78±12.12 c
|
85.86±6.15 e
|
1.63±0.02 c
|
58.1±0.50 c
|
|
50
|
11.40±0.49 a
|
234.16±11.00 a
|
171.75±4.37 a
|
2.66±0.02 a
|
73.3±0.39 c
|
|
100
|
11.06±0.37 a
|
212.82±10.41 a
|
158.9±3.82 b
|
2.02±0.02 b
|
74.7±0.36 c
|
|
200
|
11.67±0.25 a
|
186.92±9.00 b
|
148.68±5.23 b
|
2.00±0.02 b
|
79.5±0.58 cd
|
|
400
|
12.03±0.17 a
|
147.526±10.86 c
|
125.92±4.18 c
|
1.41±0.03 d
|
85.4±0.38 cd
|
|
800
|
11.92±0.13 a
|
127.34±6.55 c
|
111.28±3.79 d
|
1.29±0.02 e
|
87.4±0.89 b
|
|
1200
|
11.86±0.11 a
|
93.86±6.55 d
|
110.88±5.13 d
|
0.97±0.02 f
|
118.1±0.78 a
|
|
1600
|
11.56±0.10 a
|
78.12±5.01 d
|
106.44±3.96 d
|
0.94±0.02 f
|
136.2±0.79 a
|
(Note: Lowercase letters denote multiple comparison results. Same letters = no significant difference; different letters = significant difference at 5% level (P < 0.05))
The growth of microorganisms in the Irrigation silt soil was enhanced by low levels of Cu loadings (<200 mg Cu kg-1 soil) as evidenced by the increase in Cmic as compared to the control. However, Cmic was significantly decreased at high Cu levels (1200 mg Cu kg-1soil) (Table 3). At the loading of 1600 mg kg-1, Cmic only accounted for 52.9% of the control. The stimulating effect of Cu on microbial biomass at low inputs may result from low availability of Cu in the original soil (Table 1) as Cu is essential for the growth of microorganisms, whereas the inhibited influence was caused by Cu toxicity to the microorganisms in the soil.
There were significant increases in CO2 evolution from the soil at the external Cu loading (Table 3), which agrees with the results of Cmic measurement although an inhibited trend was observed if Cu loadings more than 50 mg kg-1.
The ratio of soil organic carbon in the microbial biomass C (defined as microbial quotient-MQ) reflects the linkage and interaction between the two parameters and the quantum of carbon immobilized into the microorganisms [20]. The MQ was increased at low external Cu loading (400 mg kg-1) (Table 3), indicating that Cu pollution in soil causes a reduced amount of C being incorporated into microbial biomass and subsequently decreases soil organic matter quality. Since Cmic only accounted for a small proportion of total organic C in soil (1-5%), change of organic C due to Cu contamination within a short term was limited and therefore, the response of MQ to Cu loading was mainly related to the response of Cmic.
The percentage of respiration rate per unit microbial biomass (called as microbial metabolic quotient - MMQ) is considered as an index for evaluation of efficiency of soil microbial community for substrate utilization [21]. Microorganisms in soils under heavily polluted stress have a lower efficiency of C utilization, resulting in more CO2 evolved per unit of substrate. The results indicated that in general the MMQ was increased with increasing Cu loading. The increase in the MMQ may result from Cu pollution stress that promoted microbial respiration and thus caused a decline in the efficiency of substrate utilization by soil microbial community. In this study, when external Cu loadings were increased from 50 to 1600 mg kg-1 raised the MMQ from 26.2% to 135%. Apparently, the response MMQ to Cu inputs can be used to indicate soil contamination by Cu at an early stage (Table 3).
Enzyme activities
In general, enzyme activities decreased with increasing external Cu loading (Figure 1). The decrease was more dramatic at low to medium levels of Cu loading (400 mg kg-1). Of the three enzymes studied, phosphatase seemed less responsive to Cu loading than invertase or urease (Figure 1)

Figure 1: Effects of Cu loading on the activities of phosphatase, invertase, and urease in CNS. There units were mg phenol kg-1 h-1, glucose mg kg-124h-1, and NH3-N mg kg-124h-1 respectively. Averages of three replicates and S.E.M. are shown.
At the highest Cu loading (1600 mg kg-1 Cu), the activity of phosphatase was decreased by over 60%, invertase activity by 99%, and urease activity by approximately 75%, as compared to the control (Figure 1). It appears that the invertase and urease activity can serve as a promising indicator of Cu contamination to the Irrigation silt soil.
Microbial community structure
The metabolic activities of soil microorganisms (utilization of diverse carbon sources in Biolog plates) rely on cell membrane integrity, enzyme activity, energy metabolism systems, and other factors. Higher Cu concentration impairs microorganisms by damaging cell membranes, chelating enzyme active sites, and generating reactive oxygen species (ROS), thereby inhibiting their ability to utilize carbon sources. In general, soil microbial metabolic activity is sensitive to metal stress. As shown in Figure 2, microbial utilization of different carbon sources was significantly stimulated by low copper concentrations (100 mg kg-1) , but was inhibited at higher Cu loading (400 mg kg-1). There was an increase in the rate of color development after 72 h BIOLOG Eco-plates incubation (Figure 2). This increase may be due to a lag in the induction of enzymes necessary to degrade some of the substrates.

Figure 2: Comparison of rate of color development on BIOLOG plates for samples with Cu loading. Each data point represents the mean AWCD value
BIOLOG metabolic profile was differentiated with varying levels of Cu loading. The Shannon index for diversity, richness (number of positive wells on Biolog plate), and evenness were calculated for each soil sample using the formulae provided by Staddon et al., [22]. PCA was performed on data divided by average well color development (AWCD) as described by Garland et al., [17]. There was a significant difference in Shannon indices of diversity as affected by Cu loading (P<0.05; Dunn’s test) (Table 4). As shown in Table 4, the Shannon index increased significantly at low copper concentrations, but further increasing the concentration of exogenous copper significantly decreased it. Shannon evenness exhibited a uniform distribution pattern. This trend indicating that the range of carbon source utilization by microorganisms was narrowed.
The soil receiving 100 mg kg-1 Cu loading had a significantly higher value of C source utilization richness, as compared to the control (Table 4), which indicating decreased structural homogeneity and functional simplification of microbial communities under stress.
|
Soil type
|
Cu concentration
mg kg-1
|
Shannon index
(H)
|
Shannon evenness
(ES)
|
Richness
(S)
|
|
anthropogenic-
alluvial soil (8 week)
|
0
|
2.13 b
|
0.715 b
|
22.06 ab
|
|
100
|
2.44 a
|
0.780 a
|
23.89 a
|
|
400
|
1.84 c
|
0.665 c
|
16.13 c
|
(Note: Lowercase letters denote multiple comparison results. Same letters = no significant difference; different letters = significant difference at 5% level (P < 0.05))
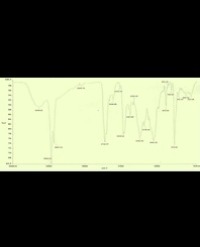
Based on the fact that different groups of microorganisms contain different fatty acids in the phospholipid fraction of their membranes, the phospholipid fatty acid (PLFA) assay is frequently used to evaluate microbial composition and estimate the amount of microbial biomass. The measured PLFAs of the Irrigation silt soil ranged from C11 to C20 (Figure 3).

Figure 3: Portion of fatty acids divided into saturated, Gram positive, Gram negative, Antinomycete, and Fungi. Value is the average of two replicates
Most of the PLFAs (C14-C20 , >C20 fatty acids) were not detected in the soil samples, indicating that the soil PLFAs were not derived from plant or animal source. The major fatty acids in the soil were bacteria, which accounted for more than 85% of the total PLFAs (Table 5).
Table 5: Ratios of bacteria, actinomycetes and fungi PLFAs in the soil
|
Cu loading (mg kg-1)
|
0
|
100
|
400
|
Average
|
|
Total PLFAs(mol%)
|
64.90
|
87.30
|
84.11
|
78.77
|
|
Bacteria PLFAs (% total)
|
88.18
|
85.18
|
90.98
|
88.11
|
|
Actinomycetes (% total)
|
0.86
|
7.64
|
6.16
|
4.89
|
|
Fungi (% total)
|
10.96
|
7.18
|
2.87
|
7.00
|
|
Actinomycete:bacteria (PLFAs)%
|
0.98
|
8.97
|
6.77
|
5.57
|
|
fungi:bacteria (PLFAs)%
|
12.42
|
8.43
|
3.15
|
8.00
|
The total PLFAs of uncontaminated soil was 64.9 mol%. Increasing Cu loading promoted the PLFAs, especially increasing the saturated bacteria PLFAs from 16.0 mol% to 39.2 mol% (100 mg kg-1) or 27.9 mol% (400 mg kg-1). The proportion of actinomycete was significantly increased but fungi were decreased especially at higher Cu loading (400 mg kg-1) (Table 5).
Different Cu loading resulted in different amounts of individual fatty acids and fatty acid ratios (Figure 3 and Table 5). Increasing Cu loading caused an increase in saturated bacteria and total microbial numbers. The control had 22 types of microorganisms which were detected by the GC system. The number of microorganisms was increased to 27 types at the loading of 100 mg kg-1 Cu, and to 32 types at 400 mg kg-1 Cu. These results indicate that microbial community structure became more complicated at increasing external Cu loading for some unknown reasons.
As compared to the control, application of external Cu at 100 and 400 mg kg-1, increased Gram positive bacteria from 11.7 mol% to 12.8 mol% and to 14.1 mol%, but decreased Gram negative bacteria from 51.6 % to 30.0% and to 45.1%, respectively, whereas actinomycetes increased from 0.56 mol% to 6.67 mol% and to 5.18 mol%, but fungi significant decreased from 7.11 mol% to 6.27 mol% and to 2.41 mol%, respectively at these Cu loadings (Table 5 and Figure 3).
DISCUSSION
Elevated levels of metals in soils can have significant negative effects on soil ecosystems. To prevent ecosystem degradation and to determine the effectiveness of remediation, sensitive methods are needed to assess the impacts of metals.
One of the proposed biological tests is the measurement of microbial biomass change. Previous studies suggest that deleterious effects may have occurred even when metal concentrations in soil remained below the limits of EU [23]. Fritze et al, [24] reported no distinction in the amount of Cmic between `less-polluted’ (below 300 mg Cu g-1) and `medium-polluted’ (300 to 1100 mg Cu g-1) regions. They observed that a 3.8-fold increase in Cu concentration induced a change in the microbial community structure (PFLA pattern) without influencing functional diversity (BIOLOG pattern). The results from the Irrigation silt soil are different from those reported. As shown in Table 3, the amount of Cmic was affected by external Cu loading even at low rates. Low levels of Cu loading (<100 mg kg-1) increased Cmic from 73.9 to 106 mg kg-1, whereas high levels of Cu loading (800-1600 mg Cu g-1 ) decreased Cmic from 63.7 to 39.1 mg g-1 soil. This trend stems from microbial adaptive responses: low Cu alleviates mild soil nutrient limitation by regulating nutrient bioavailability, promoting microbial proliferation, while high Cu causes severe toxic stress, damaging microbial cells and inhibiting growth, accompanied by initial community functional succession with copiotrophic microbes dominant under low stress.
The MQ was reported to decrease from 1.5% in soil that received uncontaminated sewage sludge to 1% in soil receiving Zn (457 mg kg-1 soil) contaminated sludge and to 0.5% in soil receiving Cu (415 mg kg-1 soil) contaminated sludge, implying that the MQ is sensitive to increased metal concentrations. The decrease in MQ could be caused by decreased microbial biomass and/or partially disabled function of its ability to mineralize organic matter. As a result of decreased MQ, turnover rate of organic matter decreased in soil with the applications of metal contaminated sewage sludge. Valsecchi et al, found that high input of metals through long-term effluent decreased the microbial quotient more than one order of magnitude, i.e. from 4% in the slightly contaminated soil to 0.2% in the heavily contaminated soil. Results from this study indicated that the MQ value decreased from 2.7% at the Cu loading of 50 mg kg-1 to 1.0% at the Cu loading of 1600 mg kg-1 (Table 3). Deepening Cu-induced toxic stress and directional community functional succession drive this decline: high Cu impairs organic matter mineralization ability, and the community shifts from a mineralization-dominated type to a stress-resistant low-metabolic type, reducing microbial contribution to soil organic carbon. These results suggest that the MQ can be a useful comprehensive indicator of soil contamination by metals such as Cu.
Microbial metabolic quotient (MMQ) has been considered an indicator of environmental disturbance of microbial population. An increased respiration rate and decreased Cmic caused by external Cu loading in the Irrigation silt soil resulted in a significant (P < 0.05) increase in the MMQ, as compare to the control (Table 3). The MMQ rise is a typical response to Cu toxic stress: microbes consume more carbon for stress-resistant substance synthesis and cellular repair, raising respiratory consumption per unit biomass. This also reflects progressive community functional succession, with an increased proportion of high-respiratory-cost stress tolerant microbes reducing overall metabolic efficiency. The MMQ seems more sensitive to external Cu loading than Cmic or BR and may serve as a useful indicator of Cu pollution to Irrigation silt soil at an early stage.
Enzyme activity has been suggested as an indicator of soil quality. The response of enzyme activity to external loading of metals varies in enzymes, soils, and metals. Inhibition of the activity of invertase, urease and phosphatase tends to reduce turnover of C, N, and P in soils. Hemida et al, [25] found urease activity was greatly decreased by Cu and Zn contamination while Yeates et al, [26] observed that in a soil contaminated with Cu, Cr, As, urease activity was inhibited to a much greater extent than acid phosphatase. Mo et al. [27], suggested that urease and invertase were most sensitive to metal pollution. In our analysis we found that increased Cu loading in the Irrigation silt soil depressed the activities of all the three enzymes (invertase, urease and phosphatase), but invertase and urease activities were more sensitive to external Cu loading than phosphatase. This differential inhibition is driven by Cu toxic stress and community functional succession: Cu binds to enzyme active sites to inactivate them, and high stress reduces synthesis/ secretion by C/N cycling functional microbes, while phosphatase stability is maintained by Cu-tolerant phosphate-solubilizing microbes, reflecting selective community succession. These results agree with previous reports by Yeates et al and Krasnova [26-28].
In this study, Biology was able to distinguish the effects of Cu contamination on the substrate utilization potential of the microbial community. BIOLOG metabolic profile analysis provided a differentiation among soils receiving varying Cu loadings. Both the rate of color development and the metabolic profiles were influenced by Cu loading. Low Cu loadings (400 mg kg-1) restricted the color development. The same trends were found for Shannon index, richness, and evenness. This variation is the macroscopic performance of Cu-driven community functional succession: low Cu alleviates nutrient limitation to promote diverse microbial metabolic activity, while high Cu toxic stress only allows survival of microbes with narrow substrate utilization spectra, reducing functional richness. These results indicate that Biology analysis can be a useful tool for assessing soil contamination by Cu. Measurement of PLFAs could provide additional information on the response of microbial community structure to external Cu loadings. However, the implications of changes in microbial community structure in soil functions are more complicated and need further study.
CONCLUSIONS
The effects of external Cu loading on Cmic , BR, MQ, and MMQ varied in application rate. Low Cu loadings (<200 mg kg-1)enhance the growth of microbial biomass and microbial activity (BR) and thus increase MQ or MMQ values in the Irrigation silt soil, whereas the reverse is true at high Cu external loadings (>400 mg kg-1). Among the three enzymes tested, invertase and urease seems more sensitive to external Cu loading and thus may be a better indicator of soil Cu contamination as compared with phosphatase. Some detectable changes occurred to microbial community physiological profile and microbial community structure as external Cu loading increased up to 400 mg kg-1, even within a short term. Therefore, BIOLOG and PFLAs measurement can be used as biological diagnosing tool for assessing soil contamination by metals such as Cu.
ACKNOWLEDGMENTS
This work was supported by the National Natural Science Foundation of China (W2421107).
REFERENCES
1. Ren C, You J, Qi Y, Huang G, Hu H. Effects of sulfur on toxicity and bioavailability of Cu for castor (Ricinus communis L.) in Cu-contaminated soil. Environ Sci Pollut Res Int. 2017; 24: 27476-27483.
2. Brookes PC. The use of microbial parameters in monitoring soil pollution by heavy metals. Biology and Fertility of Soils. 1995; 19: 269-279
3. Rob MM, Akhter D, Islam T, Bhattacharjya DK, Shoaib Khan MS, Islam F et al. Copper stress in rice: Perception, signaling, bioremediation and future prospects. J Plant Physiol. 2024; 302: 154314.
4. Zhou Z, Yu M, Ding G, Gao G, He Y. Diversity and structural differences of bacterial microbial communities in rhizocompartments of desert leguminous plants. PLoS One. 2020; 15: e0241057.
5. Xian Y, Wang M, Chen W. Quantitative assessment on soil enzyme activities of heavy metal contaminated soils with various soil properties. Chemosphere. 2015; 139: 604-608.
6. Sun X, Zhou Y, Tan Y, Wu Z, Lu P, Zhang G et al. Restoration with pioneer plants changes soil properties and remodels the diversity and structure of bacterial communities in rhizosphere and bulk soil of copper mine tailings in Jiangxi Province, China. Environ Sci Pollut Res Int. 2018; 25: 22106-22119.
7. Anderson TH, Domsch KH. Application of ecophysiological quotients (qCO2 and qD) on microbial biomass from soils of different cropping histories. Soil Biology and Biochemistry. 1990; 22: 251-255.
8. Shen ZJ, Xu C, Chen YS, Zhang Z. Heavy metals translocation and accumulation from the rhizosphere soils to the edible parts of the medicinal plant Fengdan (Paeonia ostii) grown on a metal mining area, China. Ecotoxicol Environ Saf. 2017; 143: 19-27.
9. Seshadri B, Bolan NS, Naidu R. Rhizosphere-induced heavy metal(loid) transformation in relation to bioavailability and remediation. J Soil Sci Plant Nutr. 2015; 15: 35-38.
10. Perlatti F, Ferreira TO, Romero RE, Costa MCG, Otero XL. Copper accumulation and changes in soil physical-chemical properties promoted by native plants in an abandoned mine site in northeastern Brazil: Implications for restoration of mine sites. Ecol Eng. 2015; 82: 103-111.
11. Miller W P, Miller DM. A micro-pipette method for soil mechanical analysis. Communication of Soil Science and Plant Analysis. 1987; 18: 1-15.
12. Page AL, Miller RH, Keeney DR(Ed.). Methods of Soil Analyses. Part 2.2nd Edition, SSSA Publ. Inc. Madison, WI. 1982.
13. Tabatabai,M. Effects of trace elements on urease activity in soils. Soil Biol Biochem. 1977; 9: 9-13
14. Alef K, Nannipieri P. Methods in Applied Soil Microbiology and Biochemistry. Academic Press. New York. 1995; 335–337.
15. Ross DJ. Studies on a climosquence of soils in tussock grasslands. Invertase and amylase activities of topsoils and their relationships with other properties. New Zeal.J.Sci. 1975; 18: 511-518
16. Wu J, Joergensen RG, Pommerening B, Chaussod R, Brookes PC. Measurements of soil microbial biomass by funmigation-extraction-an automated procedure. Soil Biology and Biochemistry. 1990; 22: 1167-1169.
17. Garland JL. Analytical approaches to the characterization of samples of microbial communities using patterns of potential C source utilization. Soil Biology & Biochemistry. 1996; 28: 213-221.
18. Flieβbach A, Måder P. Carbon source utilization by microbial communities in soils under organic and conventional framing practice. In: Insam, H., Rangger, A. (Eds.). Microbial Communities-Functional versus Structural Approaches. Springer Verlag, Berlin. 1996; 109-120.
19. Zelles L, Bai QY. Fatty acid patterns of phospholipids and lipopolysaccharides in environmental-samples. Chemosphere. 1994; 28: 391-411.
20. Nguyen TXT, Amyot M, Labrecque M. Differential effects of plant root systems on nickel, copper and silver bioavailability in contaminated soil. Chemosphere. 2017; 168: 131-138.
21. Insam H, Hutchinson TC, Reber HH. Effects of heavy metal stress on the metabolic quotient of the soil microflora. Soil Biology & Biochemistry. 1996; 28: 691-694.
22. Staddon WJ, Duchesne LC, Trevors JT. Microbial Diversity and Community Structure of Postdisturbance Forest Soils as Determined by Sole-Carbon-Source Utilization Patterns. Microb Ecol. 1997; 34: 125-130.
23. Giller KE, Witter E, McGrath SP. Toxicity of heavy metals to microorganisms and microbial processes in agricultural soils: a review. Soil Biology and Biochemistry. 1998; 30: 1389-1414.
24. Fritze H, Penanen T, Vanhal P. Impact of fertilizers on the humus layer microbial communities of Scots pine stands growing along a gradient of heavy metal pollution. In: Insam, H., Raugger, A (Eds.), Microbial Communities: Functional versus Structural Approaches. Springer-Verlag, Berlin, Germany. 1997; 68-83.
25. Hemida SK, Omar SA, Abdel-Mallek AY. Microbial populations and enzyme activity in soil treated with heavy metals. Water Air Soil Pollut. 1997; 95: 13-22.
26. Yeates GW, Orchard VA, Speir TW, Hunt JL, Hermans MCC. Reduction in soil biological activity following pasture contamination by copper, chromium, arsenic timber preservative. Biology and Fertility of Soils. 1994; 18: 200-208.
27. Mo X, Huang Q, Chen C, Xia H, Riaz M, Liang X et al. Characteristics of Rhizosphere Microbiome, Soil Chemical Properties, and Plant Biomass and Nutrients in Citrus reticulata cv. Shatangju Exposed to Increasing Soil Cu Levels. Plants (Basel). 2024; 13: 2344.
28. Krasnova NM. Enzyme activity as a bio-indicator of soil contamination with heavy metals. Dokl.Vses.ordena Lenina akad.K.H. Nauk Im. V.I. Lenina. 1983; 7: 41-43.
Citation
Fan K, Wang M, Yao J, Ma B, Min N, et al, (2026) Microbiologi cal Response to Copper Contamination in a Irrigation Silt Soil. SM J Biol 9(1): 6.