Research Article | Volume 2 - Issue 2 | Article DOI :
Download PDF
Emile Miégoué1*, Pégis Davy Tagning Zebaze2, Fernand Tendonkeng1, Lemoufouet Jules1, Nadège Elvire Njoh2, Ronald Komguep Nganyo2 and Etienne Tedonkeng Pamo1
1Department of Animal Production Animal Nutrition and production Research Unit, University of Dschang, Cameroon
2Department of Animal Production Ichthyology and Applied Hydrobiology Research Unit, University of Dschang, Cameroon
Corresponding Author:
Emile Miégoué, Department of Animal Production Animal Nutrition and production Research Unit, University of Dschang, Cameroon
Keywords
Clarias gariepinus ; Production Cost; Lima Bean; Fish Meal; Growth
Abstract
A study on the effect of the substitution of fishmeal by Lima bean flour was conducted between March and May 2018 within the AIO ICG of the Batié District, with the global objective of contributing to the development of alternative sources of animal protein. Specifically, the aim of the study was to evaluate the effect of the substitution of fishmeal by Lima bean flour on the growth performance, survival and feed cost of Clarias gariepinus. For this purpose, 300 fry of Clarias gariepinus with an average weight of 3 ± 1.41g were divided into five batches and fed three times a day with rations corresponding to 5% of their ichthyo biomass. The rations R0, R25 R50, R75 and R100 respectively corresponded to the substitution rates of 0, 25, 50, 75 and 100% of fish meal by that of Lima bean. The physic-chemical characteristics of the water (pH, temperature, dissolved oxygen, nitrites and nitrates) were measured daily. The following results were obtained: The highest weight gains were obtained with the rations R25 (20.56 ± 0.40 g), R50 (20.64 ± 0.32 g), R75 (20.98 ± 0.46 g) and the lowest with the ration R100 (16.21 ± 0.28 g). For this average daily gain, the highest values were 0.36 ± 0.02 g; 0.37 ± 0.01 g, 0.38 ± 0.01 g respectively for the R0, R50 and R75 rations and the lowest with R100 (0.29 ± 0.01 g). The highest value of the specific growth rate (2.47 ± 0.07%) was obtained with the ration R0 and the lowest (1.61%) with the ration R100. The consumption index reached its highest and lowest values with the rations R100 (4.74 ± 0.42) and R50 (3.57 ± 0.43) respectively, compared to the value of the ration R0 (3.31 ± 0.37) for this parameter. Concerning the condition factor K, the highest value was recorded with the R50 diet (1.11 ± 0.49) while the lowest value was obtained with the R75 diet (0.95 ± 0.45). The cost of producing one kilogram of food was higher with the R25 ration (504.59 FCFA) and lower with the R100 ration (443.20 FCFA). This study found that incorporating 75% Lima bean flour into the feed increases the growth performance of Clarias gariepinus fry and reduces the cost of food production.
Citation
Miégoué E, Zebaze PDT, Tendonkeng F, Jules L, Njoh NE, Nganyo RK, et al. Effect of Fishmeal Substitution by Lima Bean Meal on the Zoo Technical Performances of African Catfish (Clarias gariepinus) in the Batié Sub-Division, West Region of Cameroon. Int J Fisheries Sci Res. 2018; 2(2): 1009.
Introduction
Global fish production and demand are steadily increasing and have increased fivefold in less than 10 years [1]. Production increased from 39 million tons in 2010 to 174.1 million tons in 2016 [2]. In addition, its global per capita consumption per year has increased from an average of 9.9kg in the 1960s to over 20kg in 2016 [2]. In sub-Saharan Africa, fish products contribute an average of 50% of GDP in protein intake of animal origin but are still insufficient [3]. In Cameroon, the high protein demand linked to the impetus of the demographic growth of the population is generating interest in fish farming, which represents an alternative that can promote the self-sufficiency of rural populations and food security [4]. However, fish farming faces many constraints, the main ones being the lack of fry and quality feed, the unavailability of by-products and the high costs of imported food [5,6]. Because of the high costs of imported feeds and the unavailability of certain ingredients, the protein component, mainly made of fishmeal, remains the most expensive [7], and it is urgent to find alternative sources available and less expensive. Thus, several studies have been conducted on the substitution of fishmeal by other protein sources, whether of plant or animal origin [8,9]. Hence, this has led to the initiation or the attempt to replace total or partial fish meal with that of Lima bean (Phaseolus lunatus). The species Phaseolus lunatus is one of the least used legumes in Cameroon. This bean has an amino acid profile similar to that of common beans [10,11], but because of the ignorance of its nutritional potential, its culture is neglected. Thus, in order to get breeders to take an interest in this alternative source of protein, this research work has been initiated with the general objective of contributing to the development of alternative sources of protein in the diet of fish. More specifically, it was discussed to evaluate the effect of Lima bean flour on the survival rate, growth performance and finally on the economic cost of producing Clarias gariepinus.
Material and Methods
Study zone
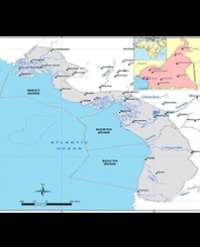
The study took place within the Joint Initiative Group of Integrated Western Aquaculture (ICG AIO), located between 5°17’0 ‘’-5°18’53 ‘’ of latitude North and 10°17’0 ‘’ - 10°19’31 ‘’ east longitude and at an altitude of 1700 m in the West Region of Cameroon, Haut Plateaux Division, specifically in the Batié Sub-division. The climate is the Sudano-Guinean type and includes a rainy season (mid-March to mid-November) and a dry season (mid-November to mid-March). The temperature and average rainfall are respectively 23°C and 1621 mm/year.
Biological material
Three hundred (300) Clariasgariepinusfry with a mean weight of 3 ± 1.41 g and a mean total length of 7 ± 1.45 cm were used. These fry were divided into five (5) batches according to the different diets tested. The loading of these fry, resulting from an artificial reproduction made within the GIC, was 20 fry per basin. Lima bean (Phaseoluslunatus) and agricultural byproducts were purchased from the Bafoussam city market.
Production of Lima bean flour
Fourteen (14) kilograms of beans were boiled 100°c for 2 hours and then dried under the sun to constant weight. It was then crushed and mixed with other agricultural by-products according to the food rations formulated.
Experimentation and data collection
To carry out this work, fifteen (15) circular basins of 1m3 each, fed with drilling water were used. The volume of water in each basin was 900 liters and renewed to two-thirds (2/3) every day. To this, three hundred (300) Clarias gariepinus fry were randomly divided into five comparable lots of size and weight with three replicates per batch. Each batch was randomly assigned to one of the R0, R25, R50, R75 and R100 experimental diets formulated. The compositions and the bromatological characteristics are given in Table 1. The feed was distributed three times a day (7am, 12h and 18h) at 5% of ichthyobiomass [12,13] for 56 days during the experiment, and the quantity was readjusted after each control fishery.
Table 1: Food Composition and Bromatological Characteristics and Cost of Different Rations.
| feeds/Ingrédients in % |
R0 |
R25 |
R50 |
R75 |
R100 |
| Fish meal |
18.6 |
13.9 |
9.3 |
4.7 |
0 |
| Bean flour |
0 |
4.7 |
9.3 |
13.9 |
18.6 |
| Corton cakes |
18.6 |
20.2 |
18 |
18 |
24.9 |
| Soybean meal |
18.5 |
20.2 |
22 |
23 |
24.9 |
| Peanut cake |
18.6 |
20.2 |
17 |
23 |
24.9 |
| Removing wheat |
7.8 |
5.4 |
3.2 |
3 |
0 |
| Rice flour |
7.8 |
5.4 |
3.2 |
4 |
0 |
| CMAV |
5 |
5 |
5 |
4 |
5 |
| Palm oil |
3.8 |
3.8 |
5 |
3 |
4 |
| Cassava |
1.5 |
1.5 |
1 |
2 |
1 |
| Total |
100 |
100 |
100 |
100 |
100 |
| Bromatological characteristics |
| Crude protein (% DM) |
39.8 |
40.14 |
40.07 |
39.9 |
39.93 |
| Metabolizable energy |
2714.86 |
2701.85 |
2752.1 |
2619.04 |
2797.2 |
| kcal / g |
| Calcium g/kg |
1.7 |
1.43 |
1.24 |
0.94 |
0.74 |
| Phosphorus g / kg |
1.15 |
1 |
0.86 |
0.7 |
0.58 |
| Ca/P |
1.49 |
1.43 |
1.42 |
1.35 |
1.27 |
| Price of one kg of feed |
522.19 |
504.59 |
487.09 |
469.48 |
443.2 |
Every two weeks, a control fishery was conducted and 25% of the fish in each treatment were individually weighed using an electronic scale of 0.1 gram precision and measured with a 0.1mm precision icthyometer. This made it possible to evaluate the growth characteristics of the fish and readjust the quantity of food to be distributed during the two following weeks.
In parallel with the data collection, the physical and chemical parameters of the water were obtained in situ between 06:00 and 07:00 in each basin: it consisted of taking the temperature, the pH, the ammonia, the nitrites, nitrates and dissolved oxygen from the water respectively using a HANNA mini-maxi thermometer, a Waterproof pH meter, a Tera nitrite chemical kit, and an EUTECH instrument or meter instrument. At the end of the test, all the fish were counted, weighed and measured.
Survival rate and growth parameters
Loss of survival (%) = (Final number of fish/Initial number of fish) x100.
Weight gain (g) = Final average weight - Initial average weight.
Average daily gain (g/d) = Weight gain/time (number of days).
Specific growth rate (%) = [ln (final average weight) - ln (initial average weight)] * 100/time; ln = natural logarithm.
Condition factor K (%) = (W/LT3) x100 with W = weight in g, L = total length.
Consumption index = quantity of food served/weight gain.
Financial evaluation
Financial evaluation of the ration was made on the basis of the prices of the different ingredients on the market and on the basis of the cost of production of the kilogram of Lima beans.
Cost of Feed Consumption = Cost of Kg of Feed x Feed Consumption.
Production Feed Cost = Feed Consumption Cost x Consumption Index.
Statistical analyzes
The growth and biochemical parameters were expressed on average plus or minus standard deviation and in percentages. One-way analysis of variance (ANOVA) was used to test the effects of treatment and the Ducan test at the 5% threshold to separate the averages when there was a significant difference. SPSS 20.0 software was used.
Results and Discussion
Results
Effect of the substitution of fishmeal by Lima bean meal in the feed on the survival rate of Clariasgariepinus.
The effect of fish meal replacement by Lima bean flour on the survival rate of Clariasgariepinus is shown in Figure 1.

Figure 1: Effect of fishmeal substitution by Lima bean meal on the survival rate of Clarias gariepinus.
R0-R100 : Rations containing respectively 0%, 25%, 50%, 75% and 100% Lima bean flour; TS: survival rate.
It shows that the highest survival rate (98.4 ± 2.3%) was obtained with the R50 ration followed by R75 and R100 (97.6 ± 2.5%). The lowest value (96.5 ± 2.5%) was recorded with the R25 diet, although no significant difference was observed between the diets (R0, R25, R50, R75 and R100).
Effect of fishmeal substitution by Lima bean flour on the growth characteristics of Clariasgariepinus: The effect of the substitution of fishmeal by Lima bean flour on growth characteristics is summarized in Table 2 and illustrated in Figures 2 to 6.

Figure 2: Effect of the substitution of fishmeal by Lima bean meal on the weight gain of Clarias gariepinus.
R0-R100: Rations containing respectively 0%, 25%, 50%, 75% and 100% Lima bean flour.

Figure 3: Effect of the substitution of fish meal by bean flour on the average daily gain of Clarias gariepinus.
R0-R100: Rations containing respectively 0%, 25%, 50%, 75% and 100% Lima bean flour.

Figure 4: Effect of the substitution of fishmeal by Lima bean flour on the specific growth rate of Clarias gariepinus.
R0-R100: Rations containing respectively 0%, 25%, 50%, 75% and 100% Lima bean flour.

Figure 5: Effect of the substitution of fishmeal by Lima bean meal on the overweight of Clariasgariepinus.
R0-R100: Rations containing respectively 0%, 25%, 50%, 75% and 100% Lima bean flour.

Figure 6: Effect of fishmeal substitution by Lima bean meal on the consumption index of Clarias gariepinus.
R0-R100: Rations containing respectively 0%, 25%, 50%, 75% and 100% Lima bean flour.
Table 2: Values of zoo technical characteristics according to the substitution rate of fishmeal by Lima bean flour.
| Parameters |
R0 |
R25 |
R50 |
R75 |
R100 |
| Ni |
60±0 |
60±0 |
60±0 |
60±0 |
60±0 |
| Nf |
57.5±1.50 |
58±1.00 |
56±1.50 |
58±0.50 |
59±0.50 |
| GP (g) |
20.25±0.44b |
18.56±0.4b |
20.64±0.32b |
20.98±0.46b |
16.21±0.28a |
| GMQ (g) |
0.36±0.02b |
0.33±0.01a |
0.37±0.01b |
0.38±0.01b |
0.29±0.01a |
| TCS (%) |
2.33±0.07b |
2.20±0.05b |
2.47±0.1b |
2.51±0.45b |
1.61±0.04a |
| K |
0.99±0.38a |
1.01±0.43a |
1.11±0.49a |
0.96±0.38b |
0.95±0.45b |
| IC |
3.31±0.37b |
3.63±0.52b |
3.47±0.43b |
3.68±0.28b |
4.74±0.42a |
Ni: Initial Number of Fish; Nf: Final Number of Fish, GP: Weight Gain; GMQ: Average Daily Gain; TCS: Specific Growth Rate; IC: Consumption Index; K: condition factor; R0-R100: Rations containing respectively 0%, 25%, 50%, 75% and 100% of Lima bean flour.
(a,b,c) averages with the same letters for the same line are not significantly different (p˃0,05).
It is generally apparent that all characteristics were significantly affected. From Table 2, it appears that the R100 diet gave the significantly (p<0.05) lowest weight gains (GP). On the other hand, no significant (p>0, 05) difference (p>0, 05) was observed between the other treatments. Regarding average daily earnings (ADG), the lowest significant (p<0.05) value was obtained with the R100 ration. The latter was comparable (p>0, 05) to rations R25. The R75 diet gave the highest value but comparable (p>0, 05) to that of the R0 and R50 values.
With respect to the specific growth rate, the values were comparable (p>0, 05) with the R0 to R75 diets and significantly low with the R100 diet. With regard to the condition factor K, it recorded the values significantly (p<0.05) higher with the ration R50, R25 and R0 and significantly (p<0.05) lower with the R75 and R100. The opposite trend was observed with the consumption index. The R100 ration gave the significantly (p<0.05) higher index value.
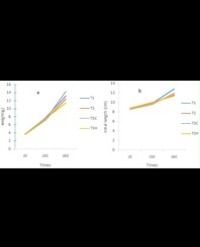
Effect of fish meal substitution by Lima bean meal on Clarias gariepinus weight gain: The effect of fish meal replacement by Lima bean flour on the weight gain of Clarias gariepinus fry, as shown in Figure 2, shows that, in general, weight gain has increased over time regardless of the food ration experienced. However, weight gains were significantly greater with the R75 (20.98 ± 0.46g), R50 (20.64 ± 0.32g), R0 (20.25 ± 0.44g) and R25 (18.56 ± 0.40 g) in contrast to the R100 diet which was the lowest value (16.21 ± 0.28 g).
Effect of fish meal substitution with lima bean meal on average daily gain of Clarias gariepinus fry: Figure 3 illustrates the effect of fish meal replacement by Lima bean flour on average daily gain in Clarias gariepinus fry. In general, it appears that the average daily gain has increased throughout the study period regardless of the treatment.
However, it was significantly (p<0.05)higher with the R0 (0.36 ± 0.02g), R50 (0.37 ± 0.01g) and R75 (0.38 ± 0.01g) rations, while the most less values 0.33 ± 0.01 g and 0.29 ± 0.01 g were obtained with R25 and R100 respectively.
Effect of fish meal replacement by lima bean meal on the specific growth rate of Clarias gariepinus: The effect of fish meal replacement by lima bean meal on the specific growth rate of Clarias gariepinus (Figure 4) shows that R0 (2.47 ± 0.07%), R25 (2.2 ± 0.05%), R50 (2.33 ± 0.1%) and R75 (2.18 ± 0.45%) were significantly (p<0.05) higher than the R100 diet (1.61 ± 0.04%) which recorded the lowest value.
Effect of fishmeal substitution by lima bean meal on the condition factor of Clarias gariepinus: The effect of the substitution of fishmeal by Lima bean flour on the condition factor K is shown in Figure 5. It is apparent that, overall, the trend, the profile and the pace are comparable between treatments. However, the rations R50 (1.11 ± 0.49), R25 (1.01 ± 0.43) and R0 (0.99 ± 0.38) recorded the significantly (p<0.05) highest values, unlike the 0.96 values ± 0.38 and 0.95 ± 0.45 of R75 and R100 respectively (Table 3).
Table 3: Correlation between the characteristics of Clariasgariepinus and the physicochemical parameters of water.
| Rations |
Growth |
correlation |
|
|
|
| characteristics |
| |
T(°C) |
pH |
NO2 |
NO3(mg/l) |
Oxygen |
| - |
| (mg/l) |
| |
K |
0.351 |
0.163 |
0.773 |
-0.026 |
-0.903 |
| |
| |
| |
IC |
0.999* |
-0.889 |
0.84 |
-0.959 |
-0.686 |
| |
GMQ |
0.639 |
-0.169 |
0.938 |
-0.353 |
-0.994 |
| R0 |
Poids |
0.371 |
0.143 |
0.785 |
-0.047 |
-0.911 |
| |
K |
-0.087 |
-0.574 |
0.423 |
0.423 |
-0.201 |
| |
| |
| |
IC |
-0.437 |
-0.828 |
0.071 |
0.071 |
-0.537 |
| |
GMQ |
0.765 |
0.985 |
0.341 |
0.341 |
0.834 |
| R25 |
Poids |
0.292 |
-0.225 |
0.731 |
0.731 |
0.181 |
| |
K |
-0.941 |
0.988 |
-0.848 |
-0.779 |
0.628 |
| |
| |
| |
IC |
-0.637 |
0.771 |
-1.000* |
-0.349 |
0.937 |
| |
GMQ |
0.357 |
0.174 |
0.513 |
-0.643 |
-0.766 |
| R50 |
Poids |
0.995 |
-0.996 |
0.693 |
0.908 |
-0.419 |
| |
K |
-0.995 |
-0.894 |
-0.893 |
-0.056 |
-0.138 |
| |
| |
| |
IC |
-0.614 |
-0.941 |
-0.289 |
0.685 |
0.622 |
| |
GMQ |
0.165 |
0.667 |
-0.201 |
-0.949 |
-0.919 |
| R75 |
Poids |
-0.941 |
-0.976 |
-0.756 |
0.189 |
0.108 |
| R100 |
K |
0.52 |
-0.024 |
0.854 |
-0.155 |
-0.024 |
| |
IC |
0.989 |
-0.931 |
-0.15 |
-0.971 |
-0.931 |
| |
GMQ |
0.866 |
-1.000** |
-0.499 |
-0.991 |
-1.000** |
| |
Poids |
-0.971 |
0.961 |
0.241 |
0.989 |
0.961 |
*Correlation is significant at 0.05 (bilateral)
**Correlation is significant at 0.01 (bilateral).
Effect of fishmeal substitution by Lima bean meal on the consumption index of Clarias gariepinus: The consumption index of Clarias gariepinus, as illustrated in Figure 6, was significantly (p<0.05) affected by the substitution of fishmeal with Lima bean flour. Thus, the lowest index value (3.31 ± 0.37) was recorded in the lots that received the R0 ration followed by the R50 ration (3.47 ± 0.43) and the highest (4.74 ± 0.42) was obtained with the ration R100. This characteristic tends to increase with the level of substitution.
Correlation between the growth characteristics of Clariasgariepinus and the physicochemical parameters of water in general, the growth characteristics were not influenced by the physical and chemical parameters of the water, with the exception of the consumption indices of the R0 and R50 diets, which significantly (p<0.05) were affected by the temperature of the water and the rate of nitrite; and mean daily gain (ADG) that was significantly influenced (p<0.05) by pH and dissolved oxygen.
Financial evaluation
The economic evaluation of the different rations is summarized in Table 4. It appears that the ration R100 had the lowest production price (443.2 FCFA), followed by rations R75 (469.48 FCFA) and R50 (487.09FCFA). However, the best value for money was obtained with the R75 ration.
Table 4: Evaluation of the cost of different rations.
| Experimental |
R0 |
R25 |
R50 |
R75 |
R100 |
| rations |
| Price of a kg of |
522.195b |
504.59b |
487.09b |
469.48a |
443.20a |
| feed |
| Feeding cost of |
1044.39 |
787.16 |
774.47 |
1065.72 |
899.69 |
| a kg of fish |
Discussion
The results show that survival rates were not significantly affected by the different percentages of fish meal substitution by Lima bean f lour. This rate varied from 96.5 ± 2.50 to 98.4 ± 2.30%. These results are similar to those obtained by Pouomogne [14] who recorded a maximum survival rate of 96.66% and those of Keremah et al. [15] who recorded a survival rate ranging from 76.7 to 96.7%. The lack of difference reflects the fact that Lima beans can substitute fishmeal without affecting the survival of fish.
Results on growth characteristics indicated that the weight gain, average daily gain, and specific growth rate of fish fed with the feed containing varying levels of Lima bean meal were significantly comparable to those in the diet. Fish receiving the control diet, with the exception of fish fed with the R100 diet. This result would indicate that the proteins and other nutrients contained in lima bean were well assimilated by Clariasgariepinus fry, indeed [16], by evaluating the influence of a food-based diet of Lima bean in Oreochromisniloticus, indicated that a substitution of fishmeal by that of Lima bean increased the growth of O. niloticus fry. During this experiment, the ration containing approximately 20% fishmeal gave the best results. This result is contradictory to that of Ekoué et al. [17] who observed that a feed of similar formulation gave better results with substitution rates of 30 and 60% of fish meal by the Lima bean flour in juveniles of Clariasgariepinus. However, the values of average daily maximum gain recorded in this study (0.35g/d) are greater than those obtained by Gandaho [18] with moringa leaves (0.19g/d) but remain ten times lower than 3g/day obtained by Micha [19] and Lacroix [20] in juveniles of Clariasgariepinus fed with feed containing respectively 40 and 30% protein and raised to 30°C. This could be justified by environmental conditions different from those of these studies, particularly the average temperature which has been around 23.01°C. The same observation is true for the specific growth rate (1.61% to 2.51%), which is higher than 0.78% reported by Keremah et al. [21] but lower than 4.14%. 5.80%/d obtained by Toko [22] in Clariasgariepinus and also lower than those obtained by Kanangire [23] in the same species, which are between 4.26; 4.05 and 3.85%/day obtained respectively for feed at Azolla (0%, 30%, and 50%). These poor performances could be justified by the conditions of the test. Indeed, the average temperatures (23.01°C) of our tests were low compared to 27.4°C Keremah et al. [21]. However, the thermal interval favorable to good growth of Clarias juveniles is between 26 and 30°C (Baras and Jobling, [24]. The observed difference could also be related to the genetic material used as to the quality of the feed because the specie is an omnivorous species with a carnivorous tendency.
The condition K factor that gives the fish overweight has varied with treatments and was greater than 1 for the R25 and R50 treatments showing a good weight according to Fulton which reports that K>1 reflects a good weight of the fish. Indeed, the K factor obtained in Clarias gariepinus during the test was between 0.95 and 1.11. These values were comparable (P>0.05) to those (0.62 to 1.86) reported by Mlewa et al. [25] in Protopterus aethiopicus and higher than those reported by Rukera et al. [26]. (0.79 to 0.83%) in Clarias gariepinus reared at multiple densities and fed with complete feed or reported by Ekoué [17] (0.06 to 0.74). The difference between these values would be related to the optimal use of plant resources in breeding.
Regarding dietary parameters, the consumption index was significantly comparable between the different diets (R0, R25, R50 and R75). However, the consumption index values recorded during the study (3.31 ± 0.37 to 4.74 ± 0.42) are far superior to the values of 1.3 and 1.7 found by Lacroix. (2004) by feeding fish in floating cages using a feed that measures 30% crude protein at a density of 100 individuals/m3. Similarly, this index was also higher than that reported by Yakubu et al. [27] at a density of 95 individual/m3. In this study, in general, the incorporation of Lima bean flour increased ingestion in Clarias gariepinus fry relative to the control diet (R0). This observation makes it possible to assume that the foods tested were more appreciated by the Clarias gariepinus fry than the R0 control food; however, their assimilation has been variable.
The food R75 represents the best value for money (469.48 FCFA per kg of food purchased and 1065 FCFA obtained per kg of fish sold) and is therefore the most efficient bioeconomically.
Conclusion
At the end of the study on the effect of the substitution of fishmeal by Lima bean flour, aimed at contributing to the development of alternative sources of animal protein the following conclusions were drawn:
The survival rate of Clarias gariepinus fry was not significantly affected by the substitution rate.
However, the highest survival rate was recorded with the lot fed with the R50 ration; all growth characteristics were significantly affected by the substitution rate.
However, it should be noted that the best characteristics were obtained with the ration R50; the feed containing 75% Lima bean flour is the most bioeconomically efficient.
In view of the above, the use of the ration substituted for 75% Lima bean increases the growth performance of Clarias gariepinus fry and reduces the cost of food production. However, the influence of Lima bean flour on reproductive parameters and the technological and organoleptic qualities of fish flesh should be examined.
References
1. FAO. Situation Mondiale Des Pêches Et De L’aquaculture. 2017.
2. FAO. La Situation Mondiale Des Pêches Et De L’aquaculture ; Département De Pêches Et Aquaculture, FAO (Ed), Rome (Italie). 2016 ; 227.
3. FAO. Situation Mondiale Des Pêches Et De l’Aquaculture. Département Des Pêches Et De l’Aquaculture De La FAO. Organisation Des Nations Unies Pour l’Alimentation Et l’Agriculture Rome. 2012.
4. Marquet J. FAO Fisheries And Aquaculture Department Publications. 1985.
5. Hishamunda N, Ridler N. Sustainable Commercial Aquaculture: A Survey 0f Administrative Procedures And Legal Frameworks. Aquaculture Economics And Management. 2003; 4 : 167-178.
6. Moehl J, Brummett RE, Kalende BM, Andcoche A. Guiding Principles for Promoting Aquaculture in Africa: Benchmarks for Sustainable Development. CIFA Occasional Paper 28, Food and Agriculture Organization of The United Nations, Accra, Ghana. 2006.
7. Alphonsus OA, Ebere S, Erondu, Onyema JO. Replacement of Fish Meal With Maggot Meal In African Catfish, (Clariasgariepinus) Diets, Revistacientificaudo Agricola. 2009; 9: 653-656.
8. Pouomogne V. Alimentation Du Tilapia Oreochromisniloticus En Étang : Evaluation Du Potentiel D’utilisation De Quelques Sous-Produits De L’industrie Agro-Alimentaire Et Modalités D’apport Des Aliments. Thèse De Doctorat d’Halieutique, ENSA De Rennes, France. 1994 ; 101.
9. Olaniyi CO, Salau BR. Utilization of Maggot Meal in the Nutrition Of African Catfish.African Journal Of Agricultural Research. 2013; 8: 4605-4607.
10. Ologhobo AD. Biochemical and Nutritional Studies of Cowpea and Lima Bean with Particular Reference to Some Inherent Nutritional Factors”. Ph. D Thesis, University Of Ibadan, Ibadan, Nigeria. 1980.
11. Aletor VA, Aladetimi OO. Compositional Evaluation of Some Cowpea Varieties and Some Under-Utilized Edible Legumes in Nigeria” Dienahrung. 1989; 33: 999-1007.
12. Tomedi-Eyango M., Tchoumboue J. Et Jamtade O. 2008. Effet Du Poids De Mise En Charge Sur La Survie Et La Croissance Des Fingerlings Du Poisson Chat Africain (Clarias Gariepinusburchell, 1822). Science Agronomique Developement. 2008; 4: 41-47.
13. Ani AO, Okpako BA, Ugwuowo LC. Effect of Feeding Time on the Performance of Juvenile African Catfish (Clariasgariepinus, Burchell 1822). Online Journal of Animal and Feed Research. 2013; 3: 143-148.
14. Pouomogne V. Growth, Feed Conversion, and Nutrient Retention Efficiency of African Catfish, Clariasgariepinus, (Burchell) Fingerlings Fed Diet with Varying Levels of Protein. 2013; 303-316.
15. Keremah RI, Davies OA, Abezi ID. Physico-Chemical Analysis of Fish Pond Water in Freshwater Areas of Bayelsa State, Nigeria. Greener Journal Of Biological Sciences. 2014; 4: 33-38.
16. Adeparusi EO, Olute BW. Effects of Methionine Supplemented Toasted Lima Bean (Phaseoluslunatus) Diets On Growth Of Oreochromisniloticus. 2000; 12: 89-98.
17. Ekoué CA. Effets De La Substitution De La Farine De Poisson Par La Farine Des Graines De Néré (Parkiabiglobosa) Et De La Farine Du Tourteau De Soja (Glycine Maxima) Sur La Croissance Et La Survie Des Juvéniles De Clarias Gariepinus (Burchell, 1822). 2013; 42.
18. Gandaho PS. Etude Des Performances De Croissance Des Juvéniles De Clarias Gariepinus (Burchell, 1822) Nourris À Base De Moringaoleifera Et De Sous-Produits Locaux. Dissertation Présentée En Vue De L’obtention Du Grade De Docteur En Sciences. 2007; 33.
19. Micha JC. La Pisciculture Africaine. Espèces Actuelles Et Nouvelles, 163 167, In Ruwet. Zoologieet Association Technique. Edition Fulreac, Liège. 1974; 381.
20. Lacroix E. Pisciculture En Zone Tropicale, GFA Terra Systems, Eulenkrug Straße Hamburg, Allemagne. 2004; 82: 359.
21. Keremah RI, Davies OA, Abezi ID. Physico-Chemical Analysis of Fish Pond Water in Freshwater Areas Of Bayelsa State, Nigeria. Greener Journal Of Biological Sciences. 2014 ; 4: 33-38.
22. Imoroutoko Halieutique Poissons Bénin) I. (Whedos) Par Poissons-Chatsclarias La Amélioration Des Trous Du Promotion Gariepinuset De Delta De La Traditionnels De Production À l’Ouémé L’élevage Heterobranchuslongifilis. (Sud Des Thèse Présentée En Vue De L’obtention Du Grade De Docteur En Sciences, Facultés Universitaires Notre-Dame De La Paix Namur-Belgique, Faculté Des Sciences. 2007 ; 214.
23. Kanangire CK. Effet De L’alimentation Des Poissons Avec Azolla Sur L’écosystème Agropiscicole Au Rwanda. Dissertation Présentée En Vue De L’obtention Du Grade De Docteur En Sciences. Facultés Universitaires Notre -Dame De La Paix, Namur, Belgique. 2001; 220.
24. Baras E. Etjobling M. Dynamics of Intracohort Cannibalism in Cultured Fish. Aquaculture Research. 2002 ; 33: 461-479.
25. Mlewa CM, Green JM. Biology of the Marbled Lungfish, Protopterus aethiopicus heckel, In Lake Baringo, Kenya. Africa Journal of Ecology. 2004; 42: 338.
26. Rukera TS, Micha JC. Et Ducarne C. Essais D’adaptation De Production Massive Des Juvéniles De Clarias Gariepinus En Condition Rurale. Tropicultura. 2005; 23: 231-234.
27. Yakubu AF, Ajiboye OO, Nwogu NA, Olaji ED, Adams TE, Obule EE. Effect Of Stocking Density On The Growth Performance Of Sex-Reversed Nile Tilapia (Oreochromisniloticus) Fingerlings Fed Unhatched Chicken Egg Diet. 2013; 5.