Research Article | Volume 2 - Issue 2 | Article DOI :
Download PDF
Nyatchouba Nsangue Bruno Thierry, Richard Kindong and Liuxiong Xu*
Department of Marine Sciences, shanghai Ocean University, China
Corresponding Author:
Liuxiong Xu, Department of Marine Sciences, shanghai Ocean University, China
Keywords
Small Scale Fisheries; Catches; production; Industrial Fishing; Aquaculture; EEZ; Inland Fishing
Abstract
This work attempts to reconstruct historical fisheries profile by filling in the missed underestimated catch information for some reasons of industrial fishing, artisanal fishing, inland fishing, illegal fishing, discards and aquaculture production of Cameroon from 1950 to 2016.This reconstruction was carried out based on data published by various authors, the Ministry of Fisheries and Livestock (MINEPIA), the Limbe Research Center on Fisheries and Oceans and FAO reports. The dataset allowed us to reconstruct the fishing profile of Cameroon by completing the missing data by interpolation. Then we compare the data obtained with those of FAO. Reconstructed catches were estimated at 13,834 tons and aquaculture production was estimated at 19 tons in 1950 compared to 12,000 tons and 14 tons published by FAO, With the agricultural reforms and development of projects focused on the primary industry, catches increased around 94,122 tons in 1977(compared to 70,167 tons reported by the FAO) to 102,975 tons in 1981(compared to 79,761 tons reported by the FAO), declined to 78,790 tons in 1986 because of the reduction of the Exclusive Economic Zone of Cameroon (EEZ) by the geographical presence of the insular part of Equatorial Guinea (Malabo Island), then increased to 186,204 tons in 2005(compared to 142,345 tons reported by the FAO), declined to 154,800 tons in 2008(compared to 129,000 tons reported by the FAO). Since 2011 it became stable and reached around 240,000 tons against 220,000 tons published by FAO. Overall, there are discrepancies between the reconstructed data and the data provided to FAO: the reconstructed data is 30% higher than the FAO data. This information about fisheries production in Cameroonian waters shows that many locals, fisheries managers and stakeholders depends on fish products for either incomes or food safety; therefore, the recent decline of fish production in Cameroon is of no good sign to the abovementioned persons. These observed fish production decline indirectly threatens the food security of the people of Cameroon and low financial income to the state coffers.
Citation
Thierry NNB, Kindong R and Xu L. Reconstruction of Historical Fisheries Profile of Cameroon. Int J Fisheries Sci Res. 2018; 2(2): 1008.
Introduction
Cameroon is located in central Africa, bordering Nigeria to the west, Chad to the northeast, the Central African Republic to the east, and Equatorial Guinea, Gabon and the Republic of the Congo to the south.
Cameroon coastline is about 402 km long extending from the border with Equatorial Guinea, south of the Campo River estuary (2°20’N) to the Nigerian border north of Akwayafe River (4°40’ N) (Figure 1).

Figure 1: Map of Cameroon representing its main maritime coastline borders (after, SNH/CPSP-ENVIREP, 2007).
The continental shelf area (up to 200 m depth) is about 13,000-14,000 km2, while the total Exclusive Economic Zone (EEZ) area is around 15,000 km2 (Folack & Galega, 1997). The territorial sea (50nm) is limited by the presence of the Island of Malabo (Equatorial Guinea). This coastline is characterized by estuaries, mangrove forests, muddy and sandy bottoms, and a dense river network as seen in Figure 1[1].
Abundant and varied fish populations show a clear predominance of warm water species. Cameroonian industrial fisheries and artisanal fisheries is dominated mainly by Parapenaeopsis atlantica (Guinea shrimp), Penaeus kerathurus (the Caramote prawn), Ethmalosa fimbriata; Sardinella maderensis; Pseudotolithus elongatus; Pseudotolithus senegalensis; Pseudotolithus typus; Chloroscumbus chrysurus, Penaeus monodon (tiger shrimp),Ethmalosa fimbriata and Sardinellamaderensis [2]. Inland fishery is dominated mainly by: Tilapia sp. Lates niloticus, Clarias spp., Heterobranchus, Auchenoglanis spp, Labeo spp., Mormyrus spp., Hemichromis sp. (Nguenga 2002; Gordon 1989, [3]. Freshwater aquaculture is dominated mainly by Nile tilapia, common carp and northern African catfish.
Presently, in Cameroon there is no data collection system in place for both marine and inland fisheries. The ARTFISH software, designed for collecting data on artisanal landings was put in place in Cameroon in 1998 by FAO and used in the 1995 frame survey. This program since then has been abandoned. Existing statistics in the artisanal sector are just vague estimations and extrapolations and the actual volume of fish production in this sector is unknown and ‘bycatch‘ is not taken into account in the national statistics, due to lack of log books on vessels [2].
Collection of fishery statistical data in both the marine and inland sectors is rendered difficult by many factors including: 1) inadequate funding by government of the MINEPIA regional and divisional services and Fisheries Research Stations responsible for data collection [4], 2) the absence of landings of fisheries products in the Douala port by majority industrial fishing vessels fishing in Cameroon waters [5,6] & Ngoande, 2011) and 3)the multiplicity, fragmentary nature of distribution and difficult access to majority of the fishing camps both inland and along the coast. Here, we used data from documents published by Cameroonian fishery authorities, FAO and some research articles respectively in an attempt to reconstruct historical profile for Cameroon fishery. The result will be benefit to address the lack of fisheries catch data in Cameroon, improve the statistical system of fishing in Cameroon and analyze the impact of the different fisheries sectors.
Methods
Artisanal fishing
Different literature sources for different recorded data years such as: for 1967 and 1970, 1980 [7], 1987 [8], 1990 (Bamou 1997), 2003 [9], 2009 [2], 2012 (Anon 2013) and Minepia [10,11] have allowed us to collect some data to be able to reconstruct the artisanal catches. According to [12], artisanal catches were 20% higher in 1967 than in 1950, indicating the upward trend in the view point of documented catches (Lagoin and Salmon, 1970) percentage that allows us to estimate catches between 1950 and 1967 knowing the catch of 1950. We interpolated to determine the missing catches between 1950 and 2016.
Industrial Fishing
Following hypothesis presented by [12], the contributions of catches in Gabon were assumed to have increased linearly from 30% in 1960 to 80% in 1970 before drastically falling to zero in 1973. Data on industrial catches come from Douala by the National Institute of Statistics Cameroon, which is responsible for collecting industrial catches; however, data presented on their website are incomplete. In addition, catches exported by transshipment at sea, landed in Nigeria or landed at the Tiko military port are not reported [2,12].
The landed recorded data provided by different literature sources between 1950 and 2016 [13,7] Bamou, 1997; Djama and NNa Abo’o, 1999; Nnana Noah, 2010 [2,4,5] were interpolated and these provided us an insight on estimating shrimp fishing experience indicated that the fish to shrimp ratio in the catch is usually 4 to 1, i.e, 4 kg fish per kg shrimp, but only half of the fish caught is reported. This approach is very conservative because it assumes that all shrimp catches by the shrimp trawlers are reported and that all catches by demersal trawlers are also reported. Similarly, crab catches represent 1.33 times the shrimp catch. We applied this rate to shrimp catches and estimated unreported crab catches. Based on data from the Limbe Fisheries and Oceanographic Research Center (Oumarou NJIFONJOU 1996), the data from the 2014 to 2016 annual reports published by the MINEPIA allowed us to reconstitute the catches of the industrial fishery between 1950 to 2016 and by interpolating we determined the catches by species which permitted us to have an idea on the state of industrial catches.
Inland fisheries in Cameroon
Some authors have estimated catches in inland waters such as Van der Knapp who estimated catches in the Lagdo River in 1960, 1990 and 1991. Core Crul (1992) who estimated the production in the Mbakaou and Bamendjin dams respectively and in 2003 Tiotsop estimated fish production in inland waters and lakes in Cameroon. Thus, to evaluate the catches of the inland waters of Cameroon, we rely on data published by various authors in rivers and lakes such as Jean Calvin Njock (1993), Gabche et al (2001), Njifonjou, (12), Nguenga (2002), the report of the national statistical institute (statistical yearbook of Cameroon, editions 2014 and 2015) and then we compared with those published by the FAO from 1980 to 2016. Then, we interpolated these various data to be able to reconstruct fishing catches in the inland waters of Cameroon between 1950 and 2016.
Aquaculture in Cameroon
Fish farming started in Cameroon in 1948. By 1952, the colonial administration had built 22 aquaculture demonstration stations to strengthen the sector. In 1960, the number of private fishponds exceeded 10,000 (Satia1991). However, soon after independence in 1960, most ponds were abandoned. The development of the Cameroonian aquaculture sector since independence has been driven largely by international donors (Kouam 2002). Production is estimated in Cameroon in various large aquaculture production areas between the 1950s and the 1970s at: Noun estimated at 1263 kg/ha/years, Menoua estimated at 1600 kg/ha/years, Menne estimated at 2000 and Lekier estimated at 2100 (world fish center, 2008). This allows us to apply on average the data estimated in number of hectare of some years which have only the number of hectare per year as from 1950 to 1960 to apply an average of 1745.75 kg/ha/years.
We therefore took the data published in 2008 by Victor Pouomogne for IRAD Cameroon (Agricultural Research Institute for Development) and Diemuth E. Pemsl for The World Fish Center, Penang, Malaysia those published by the MINEPIA (statistical yearbook of Cameroon 2014 and 2015 editions) and finally we interpolated to find the data for the other missing years. Then we compared with those published by the FAO from 1980 to 2016.
Discards
Approximately 25% of trawl shrimp catches are discarded [2]. Herein, we multiplied the estimated industrial shrimp catches by 25% to estimate discards from 1950 to 2016. For the demersal trawl, Kelleher (2005) estimated that 0.6% of demersal trawl catches were discarded. Thus, demersal trawl discards range between 0.6% for demersal trawlto 25% fortrawl shrimp, we average these two values and applied 12.8% to the estimated industrial fishing catches between 1950 and 2016 because the industrial fleet is essentially composed of demersal trawlers and shrimp trawlers.
Illegal Fishing
Illegal fishing of foreign fishing boats was first reported in 1989 [2], the activities included catch caught in Cameroon water transshipped at high sea, then landed in foreign ports most often in Equatorial Guinea and Nigeria.
According to FAO report, the annual output value of illegal fishing is estimated at $ 10 billion worldwide, among which $ 2 billion from African coastal waters. Aline Joel estimates that about 30% of the seafood extracted from oceans has not been included in any catch report (Aline Joel LEMBE. 2014). So, we apply this 30% to Cameroon’s industrial production.
Results
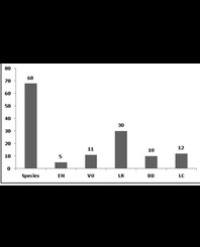
The species fished Industrial fishing in Cameroon, exclusively bottom trawling (trawlers) and shrimp and shrimp fishing, exploits only demersal species, with catches mostly found under 30 meters depth Njock 1990. Four families make up more than 80% of the catches landed in Cameroon, i.e, the Scianidae (Pseudotolithus spp.), Cynoglossidae (Cynoglossiis spp.), Ariidae (Anusspp.) and Polymenidae (Galeoides decadactylus and Pentanemus quinquarius) (Figure 2).

Figure 2: The most important catch species in Cameroon waters (1950-2016).
Marine Fishing
Marine fishing catches in Cameroon was estimated at 12,400 tons in 1950 against 12,000 tons declared by the FAO. Catches increased to the firs peak between 24,035 tons and 42,418 tons from 1970 to 1980 (compared to 20,734 tons and 22,876 tons declared by the FAO) and then declined from 68,822 tons in 1982 to 49,527 tons in 1986 (compared to 63,012 tons in 1982 and 50,636 tons in 1986 reported to the FAO) After the reduction of the EEZ of Cameroon and also political instability of the country. Catches will then increase later to reach 92,631 tons in 2000 to 100,625 tons in 2003 compared to 57,109 tons and 62,801 tons reported to the FAO, before declining to 81,000 tons in 2010 compared to 75,000 tons reported to the FAO. From 2011 until 2016 the production increased to 184,304 tons against 183,000 tons published by FAO. Between 2011 to 2013 the reconstructed data and those reported to the FAO are the same; between 2014 and 2016 difference is not large (Figure 3).

Figure 3: Reconstructed Marine fisheries and FAO Marine fisheries landing in Cameroon waters (1950-2016).
Artisanal fishing in Cameroon
The estimated artisanal catches varied between 1950 and 2016. The artisanal catches increased by 12,400 tons in 1950 to 18,700 tons in 1960. The production is in full growth since 2008 with 61,200 tons to 2016 with a quantity of 172,500 tons, passing by periods of decrease notably between 1961 and 1969 with catches ranging from 22,700 tons to 22,150 tons, and between 1980 and 1990 with catches ranging from 55,000 tons to 42,014 tons. Catches increased between 2010 and 2016 by more than 100,000 tons (Figure 4).

Figure 4: Reconstructed artisanal fishing in Cameroon waters (1950-2016).
Industrial fishing in Cameroon
Since a trawler first landed 60 tons catch in Douala in 1951, the Cameroonian industrial fleet has developed remarkably over the years, particularly in 1970 reached a production of 18,788 tons until reaching 23,175 tons in 1981. Since 1982 catches of fish have steadily declined from 14,230 tons in 1983 to between 5,000 tons and 10,000 tons from 1986 to 2001 and then suffered a total decrease in production in 2002 with production of 7,463 tons at 2010 with a production of 4,001 tons. In 2011 we have a production increase going from 15,021 tons then a decrease of 2012 with 13,000 tons until 2016 with a production of 11,804 tons (Figure 5).

Figure 5: Reconstructed industrial fishing, discard and Illegal fishing in Cameroon waters (1950-2016).
Discards
Estimated discards increased from about 8 tons in 1951 to a peak of 2,599 tons in 1980 following the industrial increase in catches from Cameroon, and then rapidly decreased to 590 tons in 2005. Between 2010 and 2016 there was a change of 513 tons at 1, 511 tons (Figure 5). All these discards come not only from the fact that 90% of fishing vessels in Cameroonian waters are shrimp trawlers, but also that some fisheries resources of Cameroonian waters are overexploited.
Illegal Fishing
Estimated illegal fishing increased from about 18 tons in 1951 to a peak of 6,090.6 tons in 1982 following the industrial increase in catches from Cameroon, and then rapidly decreased to 1,381 tons in 2005. Between 2010 and 2016 there was a change of 1,200 tons at 3,542 tons (Figure 5).
Inland Fisheries in Cameroon
With a fishing potential estimated at more than 80,000 tons per year, the inland fishery is growing every year, the catches increased from around 34,000 tons in 1950 to a firs peak of 50,000 tons in 1970, and then declined rapidly to 28,000 tons in 1980 compared to 20,000 tons reported to the FAO. Catches will then increase later between 2000 and 2016, production increases progressively, firstly around 70,000 tons in 2000(compared to 55,000 t tons reported to the FAO) to second peak of 105,000 tons in 2005(compared to 75,000 t tons reported to the FAO) and secondly around 160,821 tons in 2010 (compared to 75,000 tons reported to the FAO) to peak of and 189,018.6 tons in 2016(compared to 75,000 tons reported to the FAO) (Figure 6).

Figure 6: Reconstructed Inland fisheries in Cameroon (1950-2016).
Aquaculture
Aquaculture production in Cameroon was estimated at 19 tons in 1950 against 14 tons declared by the FAO. Catches increased to the firs peak of 478 tons (compared to 367declared by the FAO) and then declined to 56 tons (compared to 40 tons reported to the FAO). Catches will then increase later to reach second peak of 182 tons in 1985 compared to 130 tons reported to the FAO, and then declining to 80 tons in 1995 compared to 57 tons reported to the FAO. Before gradually increasing from 798 tons in 2010 tons (compared to 570 tons reported to the FAO) to the thirdly peak around 1116 tons in 2015 tons (compared to 840 tons reported to the FAO) (Figure 7).

Figure 7: Reconstructed aquaculture production in Cameroon waters (1950-2016).
Discussion
The constructed data sets are divergent with those published by the FAO in terms of amount and trend with a difference of more than about 30%. This divergence is due first of all to the fact that at the level of marine fisheries, the fishing vessel control system set up by the government is not effective. This lack of control pushes some fishing vessels to land their catches in the uncontrolled fishing camps or the military port of Tiko, especially Nigerian fishing vessels operating in Cameroonian waters.
Artisanal fishermen, 40% of whom are foreigners, including Nigerian and Ghanaian, who do not declare their catches and lack of control in this sector, where more than 45% of fishermen find themselves without a government-recognized fishing license whose catches are not reported to the National Statistical Institute which communicates the data to FAO.
At the level of inland fisheries, this divergence is due to the lack of control of the sector by MINEPIA and also due to the sharing of certain waters such as Lake Chad which is exploited by Cameroonians, Chadians and Nigerians, so that the control exact of the catches are almost impossible. Finally, note that the current state does not have the hand in this sector hence the estimate of data published by the FAO.
at the level of the aquaculture sector, This divergent between the reconstituted data and published by the FAO is due to the fact that some ponds are not declared to the government and also because MINEPIA has not established a control system for fish farmers. So, National Statistical Institute relies solely on data received by different research organizations, such as the Limbe Research Center on Fisheries and Oceans, also at Kribi, or by MINEPIA to estimate the annual production of aquaculture, and which transmits same data to FAO.
The coastal zone is an ecologically sensitive zone and trawling in this zone is susceptible of destroying habitats of small commercial important juvenile fishes of which most are often captured as bycatches, then are often thrown overboard by the artisanal fishers themselves. Illegal transshipment involves bags of young fish that are often seen in canoes of artisanal fishermen who go out with money or gifts after arrangements with the vessel captains in exchange for fish (illegal sales at sea). This adds the practice of discarding a great portion of catches overboard – bycatch which is not taken into account in the national statistics, due to lack of log books on vessels. In the same line, some vessels have escaped the Douala port, gotten matriculated in Limbe and land their catches unofficially in the Tiko military and commercial port. Even though fisheries service exists in Tiko, the landings effected are not well documented and don’t really reach the integrity of the national statistics.
we recommend that Cameroon take into account the recommendations of IPOA-IUU who recommends states to put in place an efficient monitoring, Control and Surveillance system (MCS) for fishing, notably by taking into consideration amongst others, regulated access to resources (Article 24 and it’s sub-articles). In an attempt to abide by to this, an MCS system is in place (Order N0. 0021/MINEPIA of 11 April 2002) in Cameroon, though poorly functional due to lack of trained staff and appropriate equipment [14-16] but there is no mechanism to regulate access. Presently, BCSAP (Control Brigade) have limited means to execute its mission because it lacks a coastal command center, a limited number of operational tools and sufficient finances. Procedures for collecting quality data for efficient monitoring and control are practically nonexistent. It is therefore necessary to develop and put in place tools to guarantee monitoring and effective control. Furthermore we recommend Cameroon to apply fishing management system formulated in 2011 by MINEPIA [2].
We also recommend to Cameroon to:
Installing and improving the scale of data collection on all industrial vessels in collaboration with other administrative departments at ports. This will involve the institution of an official log book onboard industrial fishing vessels for regular declaration of catches by operators;
Reinforcing MCS through an effective system of vessel monitoring, registering of vessels and proprietors, training of control agents and planning, financing and establishing a system of data-sharing and archiving;
Conclusion
The purpose of this article was to reconstruct the fishery profile in Cameroon for 1950 to 2016 based on published data by different authors, Ministry of Livestock Fisheries and Animal Husbandry (MINEPIA), Limbe Fisheries and Oceans Research Center and FAO reports. This dataset allowed us to reconstruct the fishing profile of Cameroon by completing the missing data by interpolation. Then we compare the data obtained with that of FAO.
The fishery production in Cameroon was marked by two main cycles: for the first cycle, catches increased to a first peak in the 1970s after major agricultural reforms and development projects focused on the primary industry, before the decline in 1982 partly due to the considerable reduction of the exclusive economic zone of Cameroon which saw the production drop to 70000 tons. The second cycle was marked by the highest peak of catches, which reached more than 220000 tons in 2013 and has been constant since then. Overall, reconstructed fisheries profile was about 30% higher than the data supplied to the FAO.
In this sense, this article proposes to treat the question of the sustainable development of fishing in Cameroon by proposing solutions facilitating the control of the catches in Cameroonian waters and Cameroon aquaculture production. The solutions permitting to have a good data collection system and finally have good fisheries management.
References
1. Amou’ou, Jam JP, Melingui A, Moukam J, Tchepanou A, et al. Cosatal conditions in West Africa. A review. Ocean and Coastal Management. 1985; 19: 199-240.
2. ENVIREP-CAM. Overview of Management and Exploitation of the Fisheries Resources of Cameroon, Central West Africa. Institut de Recherche Agricole pour le Développement, Yaoundé. 2011; 70.
3. Ngwa WM. Unequal probability catch assessment survey of Lagdo Reservoir, Garoua Rey Bouba district, Cameroon. (miméo). 1990.
4. MINEPAT. Loi de finances 2013, Ministère de l’Economie, de la Planification et de l’Aménagement du Territoire. 2009.
5. FAO. Accord for conservation and management of living resources in high can be retrived from the following site. 2017.
6. Chiambeng GY. Cameroon National Report on Marine and Coastal Biodiversity. Research Station for Fisheries and Oceanography, Cameroon. 2006; 61.
7. Ssentongo G, Njock J. Marine fishery resources of Cameroon: a review of exploited fish stocks. CECAF/ ECAF Series 87/44, FAO, Rome.1987.
8. Seck P. Catalogue des engins de pêche artisanale maritime du Cameroun. COPACE/PACE Series 87/43, FAO, Rome. 1987.
9. NOOA. International Agreements concerning living marine resources of interest to NOAA fisheries. National Marine Fisheries service, NOAA, US department of Commerce. Compiled and edited by Melani King. 2009. 216.
10. MINEPIA, Reports. Rapport Annuel d’activite de la delegation provinciale de l’elevage des pêches et industrie animale du littoral. Par Antoine Tchoubia. 2014.
11. MINEPIA. Projet Appui à la mise en place d’un système statistique informatisé pour la pêche artisanale Captures de la pêche continentale dans la province du Sud-Ouest. 2005.
12. Belhabib D, Hellebrandt D, Edward E and Pauly D. Reconstructing fisheries catches for Cameroon between 1950 and 2010. Sea Around Us, Fisheries Centre, Uni- versity of British Columbia 2202 Main Mall, Vancouver, BC, V6T 1Z4, Canada. 2015; 10.
13. Laure J. Vingt ans de pêche industrielle au Cameroun. Extrait de La Pêche Maritime 136, ORSTOM. 1972; 4.
14. FAO. Accord for conservation and management of living resources in high. 2017.
15. FAO. Gestion participative et conservation de la biodiversite de mangroves. Volet Peche et Aquaculture. Projet mangrove FAO-Cameroon. TPC/ CMR/2908B. 2005.
16. FAO. Plan de development durable de l’aquaculture au Cameroon. 2009; 58.