Research Article | Volume 5 - Issue 1 | Article DOI :
Download PDF
Mohammed ZB1*, Abdullahi SA2, Dambo A2, Abdullateef AY2 and Ocholi Y3
1Department of Fisheries, University of Maiduguri, Nigeria
2Department of Biology, Ahmadu Bello University Zaria, Nigeria
3Department of Microbiology, Ahmadu Bello University Zaria, Nigeria
Corresponding Author:
Mohammed ZB, Department of Fisheries, University of Maiduguri, Borno State, Nigeria
Keywords
Improvement; Clarias galmeansis; Hybridization; Genomic; Sperm; Mediated; Gene
Abstract
Studies on the improvement of growth performance of Clarias galmaensis through hybridization and genomic DNA from Heterobranchus bidorsalis using sperm mediated gene transfer technique was carried out with the aim of determining the growth performance of Clarias galmaensis treated with genomic DNA and hybridization. Twenty one each of male and female Clarias galmeansis and three each of male and female Heterobranchus bidorsalis were used for the experiment. Female broodstock were induced with ovaprim and kept for latency period, after latency period, one gram (1g) of egg were collected from each fish and fertilized with 1mil of milt collected from the male broodstock. Treatment 1 to 5 involved introduction of genomic DNA of Heterobranchus bidorsalis to the milts at the concentrations of 0, 10, 20, 30 and 40μl before the fertilization while treatment 6 to 8 involved the use of hybridization between Clarias galmaensis and Heterobranchus bidorsalis. After fertilization, the eggs were incubated and raised for 30 days indoors on commercial diets. Thirty (30) fingerlings were selected from each treatment and reared for another four (4) months for growth performance. Data obtained from the research were subjected to analysis of Variance ANOVA. The results shows that the growth performance parameters were better in treatment with ?Female Heterobranchus bidorsalis x ?Male Clarias galmaensis (?Hb x ?Cg) in terms of final mean weight, mean weight gain, mean daily weight gain, percentage weight gain, feed conversion ratio, protein efficiency ratio and percentage survival as 14.26.3g, 1346.7g, 8.86g, 94.38%, 2.07%, 0.50 and 22.43 respectively while final length was higher in breeding combination female and male Clarias galmaensis (Cg x ?Cg) with genomic DNA at 30μl with 1464.7mm. This indicates that Clarias galmeansis can be improved through both hybridization and inclusion of genomic DNA from Heterobranchus bidorsalis.
Citation
Mohammed ZB, Abdullahi SA, Dambo A, Abdullateef AY, Ocholi Y (2023) Improvement of Growth Performance of Clarias galmaensis through Hybridization and Genomic DNA from Heterobranchus bidorsalis using Sperm Mediated Gene Transfer Technique. Int J Fisheries Sci Res 5: 9.
Introduction
The development of genetically modified fish has undergone intensive research since the first production of genetically modified mammals. Genetically modified fish are being developed for both academic and applied goals, allowing the production of useful model systems as well as new genetic strains with improved characteristics for aquaculture [1]. A foreign gene can be transferred into fish in vivo by introducing Deoxyribonuclic Acid either into embryos or directly into somatic tissues of adults [2].Transgenic organisms are of great value in providing new insights into mechanisms of gene regulation and development. In aquaculture, growth improvement is the main key to increase the production. In addition, increasing fish growth would give a lot of benefits including shortening production time, increase feed efficiency and control product availability [3]. Gene transfer is a technique which is considered fast and an effective way to increase somatic growth for aquaculture production [3]. Fish hybridization is the crossing of different fish species, genera as well as families from first filial generation, backcrossing or out crossed to give hybrids of desired qualities. However Adah et al. [4], reported that hybridization is a process of generating a new form of animal through human intervention (Aquaculture) or naturally by crossing genes of different species. Fish hybridization is an essential genetic technique that removes undesirable characteristics resulting from inbreeding such as deformity, while retaining the desirable traits [5]. Hybridization has been used to improve fish, increase growth rate, manipulate fish sex, produce sterile fish, and improves flesh quality, increase semen volume, increase disease resistance, and environmental tolerance [5]. It also produces offspring that perform better than both parental fish species (positive heterosis). Clarias galmaensis originated from river Galma in Zaria, Kaduna State. The body is typically clariid in appearance. The colour does not appear to show variation in live material; the dorsal surface is usually olive-green to brownish-green, very slightly lighter on the flanks and speckled with dirty-white to creamy spots that extend into the fins. The ventral surface is deep cream to grey and pale brownish, sometimes tinged with yellow and pink [6]. The barbels are very prominent, long, dark brown to black; all the fins are dark brown to black except the ventral fins (anal and pelvic) which are very slightly lighter in colour. The pectoral fin is spined; the spine is strongly serrated along its inner and outer margins. The head is relatively short, oval to roundish in dorsal view and goes into the body length about 3.9-4.1 times. The first gill arch bears 12 to 18 long closely set gill rakers. The maximum weight of fish obtained was 75g and maximum standard length 20.8cm [6]. Heterobranchus bidorsalis, the African catfish or eel-like fattyfin catfish, is an airbreathing catfish found in Africa [7]. It is closely related to the vundu catfish, which is well-known among fishermen [7]. The head of Heterobranchus bidorsalis is shaped like an oval and has a rectangular dorsum. The snout is round and the eyes are lateral. The frontal fontanelle is long and narrow while the occipital fontanelle is relatively long and is shaped like an oval. The postorbital bones are completely united. The suprabranchial organ is well developed. The pectoral spine is smooth. The body and fins may have spots. It can reach a length of 150 cm (59.0 inches) TL. The maximum recorded weight for this species is 30.0 kg. The species has 40-46 dorsal (in the back) soft rays, 49-58 anal soft rays, and 62-63 vertebrate [8]. Genomic DNA (gDNA) is the DNA residing in chromosomes inside the nucleus, with all the biological information to be transferred to the next generation. The words genome and genomic came from the word gene [9]. A gene is a set of codons that specify a specific protein chain, along with the associated start and stop codons. The word genome is an extension of this concept and means the collection of all genes and other information contained inside the nuclei of an organism’s cells. Deoxyribonucleic acid, (DNA) is the molecule that carries the instructions for all aspects of an organism’s functions, from growth, to metabolism, to reproduction. In living organisms, most of the DNA resides in tightly coiled structures called chromosomes, located inside the nucleus in each cell. DNA is made up of four different building blocks, called nucleotides, which are each made up of one of four nitrogenous bases [9]. These are the purines: guanine (G) and adenine (A), and the pyrimidines: thymine (T) and cytosine (C). These nucleotides are coupled to a deoxyribose sugar and are able to bind to other deoxyribose sugars via phosphate linkages to form long chains, some of which can be well over 100,000,000 molecules long. Since each deoxyribose in a DNA chain is coupled to one of the four nitrogenous bases (G, A, T, or C), these long chains can carry information [9]. Sperm mediated gene transfer method is based on the ability of sperm cells to bind to a foreign DNA and transport into the oocyte during fertilization [10]. Several research had been conducted to improve growth performance of the fish belong to the claridae family using several techniques such as microinjection, particle gun bombatmemt, hybridization and electrophoresis by Buwono et al [11-18]. These techniques yielded positive results though; they are expensive and time consuming. Despite the increase in the production of Clarias species as a major fish in Nigeria, some of the species are still associated with some challenges in terms of growth performance and flesh quality (Clarias galmaensis). Therefore, this work tends to improve growth performance of Clarias galmeansis through hybridization and sperm mediated gene transfer technique which is simple less cost.
Materials and Methods
Study Area
The experiment was conducted at the teaching and research farm of Department of Fisheries, University of Maiduguri situated between latitude 11o 51 N and longitude 13o 051 E. Maiduguri basically has two seasons; dry and rainy seasons. On average, the temperature is always high. The months of June, July, August and September have a high chance of rainfall while the months of January, February, March, April, October, November and December are regarded as the dry season. The warmest month in Maiduguri is April with an average maximum temperature of 40oC (104oF). The coldest month is January with maximum temperature of 31oC (87oF). August is the wet month while November is the driest month [19].
Experimental Fish
Clarias galmaensis broodstocks were obtained from River Galma located in Kaduna State, Nigeria. The river is situated on a latitude 10° 38’ 19” N and longitude 7° 42’ 5” E [20], while Heterobranchus bidorsalis samples were obtained from Lake Chad basin along Baga axis of Kukawa local government area of Borno State about 196 kilometers away from Maiduguri, both samples (Clarias galmaensis and Heterobranchus bidorsalis) were transported life to the hatchery unit of the Department of Fisheries, University of Maiduguri in 50L Jeri cans half filled with fresh water. Clarias galmaensis and Heterobranchus bidorsalis samples were acclimatized for 48 hours in 2 x 1m2 concrete ponds before were fed 35% crude protein diet at 5% of their body weight three times daily. The samples were kept in tempoline pond for 90 days before the commencement of the experiment.
Extraction of Genomic DNA from Heterobranchus bidorsalis
Genomic DNA was extracted from whole blood samples of Heterobranchus bidorsalis collected via their caudal peduncle using 2ml syringe. The extraction was carried out using Zymo Kit, Quick- DNATM Miniprep plus Kit protocols with a Catalog No: D4069.
Experimental procedure
Twenty one (21) each of female and male Clarias galmaensis broodstock and three (3) each of female and male Heteroranchus bidorsalis broodstocks were used for the research. Treatment 1 to 5 involved crossing of female ♀Clarias galmaensis x ♂male Clarias galmaensis (♀Cg x ♂Cg) with the treatment of genomic DNA from Heterobranchus bidorsalis at different concentrations mixed with milts during fertilization while treatment 6 to 8 involved crossing of pure line of Clarias galmaensis with Heterobranchus bidorsalis without treating with genomic DNA in the following combination;
♀ Female Clarias galmaensis x ♂Male Clarias galmaensi (♀Cg x ♂Cg)
♀Female Clarias galmaensis x ♂Male Heterobranchus bidorsalis (♀Cg x ♂Hb)
♀Female Heterobranchus bidorsalis x ♂Male Clarias galmaensis (♀Hb x ♂Cg)
The female samples were induced with ovaprim hormone at 0.5ml/kg via intramuscularly using 2ml syringe inserted 2-2.5cm between the base of the dorsal fin and the lateral line at an angle of 45o pointing towards the tail (dorsally) and the injected points were massage in order to distribute the hormone evenly. After the injection, the samples were kept separately in 50 litre plastic basin for 12 hours latency period. After the latency period, milts from the males were collected before stripping based on the crossing combination. The milt were cut at the lobes using surgical blade and washed with physiological solution to remove blood. The milt were then squeeze into 10ml beaker. Eggs from the females were stripped into plastic container and 1g of the eggs was allotted to each replication. 0.5ml of the milts from each of the male was used to fertilize the eggs from each of the females. For treatment 1 to 5, genomic DNA from the Heterobranchus bidorsalis was added to the 0.5ml of the milts collected from the males at the concentrations of 0, 10, 20, 30 and 40μl before fertilizing the eggs while for treatment 6 to 8, no genomic DNA was added to the milt before fertilization. The genomic DNA was measured using MPA -200 pippete gauge. All the experiments were replicated three times and conducted under complete randomized design manner. After fertilization, the eggs were incubated in 50 litres water capacity plastic basin under a flow through system. After the incubation, the hatchlings were managed to fingerlings stage on commercial diets for 30 days indoors.
Growth and Survival of the Fingerlings
At the end of the 30 days indoors rearing period, 30 fingerlings from each treatment (i.e 10 fingerlings per replication) in each experimental unit were stocked in 1x1x1 m3 hapa net installed in 7 x 5 x 1.2 m3 polyethylene lined pond and reared for four (4) months. At the end of the four months rearing periods the following data were recorded; final weight (g), final length (mm), survival rate and quantity of feed consumed. The following growth indices were estimated for each of the treatments both crossing combination in experiment unit 1 and genomic DNA concentrations in experiment unit 2 (0, 10, 20, 30 and 40μl) using the formulae;
i. Weight gain (g) = W2 – W1, where W2 and W1 are the final and initial weight of fish, respectively [21].
ii. Percentage weight gain = W1 /W2 x 100, where W2 and W1 are the final and initial weight of fish, respectively [22].
iii. Final length (mm) = L2 – L1, where L2 and L1 are the final and initial length of fish respectively [21].
iv. Specific growth rate (SGR % per day) = loge Wi - loge Wo/t× 100, where loge Wi = log of final weight, loge Wo = log of initial weight, loge = logarism and t = culture period [22].
v. Protein efficiency ratio (PER) = Weight gain (g) / Protein intake [23].
vi. Feed Conversion Ratio (FCR) = Dry weight of feed (g)/Weight gain of fish (g).
vii. Percentage survival = n2 – n1/t × 100, where n2 and n1 are the final and initial number of the fish respectively, t= the culture period [23].
Water Quality
Parameters Temperature (OC), pH, Electric conductivity (m/s), dissolved oxygen (mg/l) and total dissolved solid (ppm) were recorded during the culture period using six - in - one water quality monitor, Model: PHT- 027 China.
Data Analysis
Data generated from growth performance were subjected to one-way analysis of variance (ANOVA). The differences between means were determined using Fisher’s LSD at (P<0.05) with the aid of Statistix 8.0.
Results
Growth Performance of F1 Progenies Produced through Genomic DNA and Hybridization between Clarias galmeansis and Heterobranchus bidorsalis
The growth performance and survival of F1 progenies produced through genomic DNA and hybridization between Clarias galmeansis and Heterobranchus bidorsalis are presented in table 1.
Table 1: Growth performance of F1 Progenies Produced through Genomic DNA and Hybridization between Claras galmeansis and Heterobranchus bidorsalis.
|
Parameter
|
Genomic DNA Inclusion Level (μl) and Hybridization
|
|
0
|
10
|
20
|
30
|
40
|
♀Cg x♂Cg
|
♀Cg x♂Hb
|
♀Hbx♂Cg
|
P
values
|
|
IMW(g)
|
78.707±4.09a
|
73.50±4.09a
|
72.70±4.09a
|
78.00±4.09a
|
79.17±4.09a
|
79.63±4.09a
|
84.93±4.09a
|
80.07±4.09a
|
0.53
|
|
IML mm
|
573.3±20.27a
|
556.7±20.27a
|
530.0±20.27a
|
573.3±20.27a
|
556.7±20.27a
|
620.0±20.27a
|
580.0±20.27a
|
566.7±20.27a
|
0.20
|
|
FMW(g)
|
298.0±54.33 e
|
624.3±54.33 d
|
850.0±54.33 c
|
1106.7±54.33 b
|
656.7±54.33 d
|
277.7±54.33 e
|
1213.0±54.33 b
|
1426.3±54.33 a
|
<0.001
|
|
FML(mm)
|
863.3±71.32d
|
1434.3±71.32a
|
1370.7±71.32ab
|
1464.7±71.32a
|
1282.0±71.32abc
|
722.0±71.32d
|
1087.0±71.32c
|
1200.0±71.32bc
|
<0.001
|
|
MWG (g)
|
219.3±53.73e
|
550.8±53.73d
|
777.3±53.73c
|
1028.7±53.73b
|
577.5±53.73d
|
198.3±53.73e
|
1128.3±53.73b
|
1346.7±53.73a
|
<0.001
|
|
MDWG
|
1.40±0.35e
|
3.62±0.35d
|
5.11±0.35c
|
6.76±0.35b
|
3.80±0.35d
|
1.30±0.35e
|
7.42±0.35b
|
8.86±0.35a
|
<0.001
|
|
PMWG %
|
73.56±1.56c
|
88.04±1.56b
|
91.39±1.56ab
|
92.94±1.56a
|
87.46±1.56b
|
70.86±1.56c
|
92.96±1.56a
|
94.38±1.56a
|
<0.001
|
|
SGR %
|
1.67±0.03d
|
1.87±0.03c
|
1.93±0.03bc
|
2.00±0.03ab
|
1.87±0.03c
|
1.62±0.03d
|
2.05±0.03a
|
2.07±0.03a
|
<0.001
|
|
FCR
|
2.06±0.13a
|
0.93±0.13bc
|
0.73±0.13bcd
|
0.57±0.13d
|
1.03±6.37b
|
2.37±6.37a
|
0.60±6.37cd
|
0.50±0.03d
|
<0.001
|
|
PER
|
3.63±0.89e
|
9.17±0.89d
|
12.97±0.89c
|
17.17±0.89b
|
9.60±0.89d
|
3.30±0.89e
|
18.80±0.89b
|
22.43±0.89a
|
<0.001
|
|
MPSV %
|
76.67±5.40a
|
80.00±5.40a
|
83.33±5.40a
|
76.67±5.40a
|
70.00±5.40a
|
83.33±5.40a
|
76.67±5.40a
|
86.67±5.40a
|
0.49
|
|
MNOF
|
5.67±0.68a
|
5.67±0.68a
|
4.67±0.68a
|
5.33±0.68a
|
4.00±0.68a
|
6.00±0.68a
|
4.00±0.68a
|
5.00±0.68a
|
0.34
|
|
MNOM
|
2.00±0.45a
|
2.33±0.45a
|
3.67±0.45a
|
2.33±0.45a
|
3.00±0.45a
|
2.330.45a
|
3.67±0.45a
|
3.67±0.45a
|
0.07
|
Means with the same superscripts within the same row were not significantly different (P>0.05).
Legend- IMW = Initial mean weight, IML= Initial mean length, FMW= Final mean weight, FML= Final mean length, MWG= Mean weight gain, MDWG= Mean daily weight gain, PMWG= Percentage mean weight gain, SGR= Specific growth rate, FCR=Feed conversion ratio, PER= Protein Efficiency ratio, MPSV= Mean percentage survival, MNOF=Mean number of female, MNOM=Mean number of male
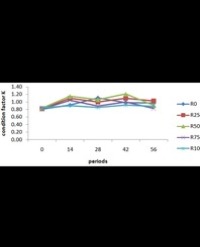
There was no significant differences (P>0.05) in the initial mean weight and initial mean length among all the treatments and the control. The initial mean weight ranged from 72.70 to 84.93g while the initial mean length ranged from 530.0 to 620.0mm. The F1 progenies produced through hybridization combination of ♀Hb x ♂Cg (T8) recorded the highest final mean weight of 1426.3g followed by F1 progenies produced through hybridization combination of ♀Cg x ♂Hb (T7) with 1213.0g then F1 progenies produced through breeding combination of ♀Cg x ♂Cg with 30μl of genomic DNA inclusion (T4) having the value of 1106.7g. F1 progenies produced through breeding combination of ♀Cg x ♂Cg with 20 (T3), 40 (T5) and 10μl (T2) of genomic DNA inclusion with a values of 850.0, 656.7 and 624.3g respectively. The control treatment that is F1 progenies produced through breeding combination of ♀Cg x ♂Cg with 0μl (T1) of genomic DNA inclusion recorded the lower value of the final mean weight of 298.0g while F1 progenies produced through hybridization combination of ♀Cg x ♂Cg (T6) recorded the least value of 277.7g. There was a significant difference (P<0.05) in the final mean weight of the F1 progenies produced through hybridization combination of ♀Hb x ♂Cg (T8) and the other treatments. Similarly, there was a significant difference (P<0.05) in the final mean weight of the F1 progenies produced through breeding combination of ♀Cg x ♂Cg with 20 μl (T3) of genomic DNA inclusion and with the other treatments. There was no significant difference (P>0.05) in the final mean weight between F1 progenies produced through breeding combination of ♀Cg x ♂Cg with 30μl (T4) of the genomic DNA inclusion and F1 progenies produced through hybridization combination of ♀Cg x ♂Hb (T7), between F1 progenies produced through breeding combination of ♀Cg x ♂Cg with 10 (T3) and 40 μl (T5) of the genomic DNA inclusion as well as between the control treatment that is F1 progenies produced through breeding combination of ♀Cg x ♂Cg with 0 μl (T1) of the genomic DNA inclusion and F1 progenies produced through hybridization combination of ♀Cg x ♂Cg (T6). The monthly increase in weight of the F1 progenies produced through breeding combination with different level of genomic DNA inclusion and hybridization combination is presented in figure 1.

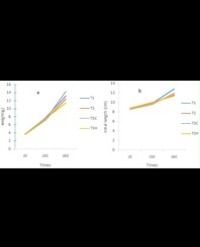
Figure 1: The monthly increased in weight of the F1 progenies produced during the experiment.
The final mean length as shown in Table 1 was higher in F1 progenies produced through breeding combination of ♀Cg x ♂Cg with 30μl (T4) of the genomic DNA inclusion as 1464.7mm followed by F1 progenies produced through breeding combination of ♀Cg x ♂Cg with 10μl (T2) of the genomic DNA inclusion with a value of 1434.3mm then F1 progenies produced through breeding combination of ♀Cg x ♂Cg with 20μl (T3) of the genomic DNA inclusion having the value of 1370.7mm while F1 progenies produced through breeding combination of ♀Cg x ♂Cg with 40μl (T5) of the genomic DNA inclusion produced the value of 1282.0mm. F1 progenies produced 1200.0 and 1087.0mm respectively. Lower value of the final mean length of 863.3 was presented in the control treatment F1 progenies produced through breeding combination of ♀Cg x ♂Cg with 0μl (T1) of the genomic DNA inclusion while the least value of the final mean length of 722.0mm was revealed in F1 progenies produced through hybridization combination of ♀Cg x ♂Cg (T6). There was no significant difference (P>0.05) in the final mean length of F1 progenies produced through breeding combination of ♀Cg x ♂Cg with 10μl (T2), 20μl (T3), 30μl (T4) and 4μl (T5) of the genomic DNA inclusion. Similarly, There was no significant difference (P>0.05) in the final mean length of F1 progenies produced through breeding combination of ♀Cg x ♂Cg with 20μl (T3), 40μl (T5) and F1 progenies produced through hybridization combination of ♀Hb x ♂Cg (T8). There was also no significant difference exist (P>0.05) in the final mean length of F1 progenies produced through breeding combination of ♀Cg x ♂Cg with 40μl (T5) and F1 progenies produced through hybridization combination of ♀Hb x ♂Cg (T7) and ♀Hb x ♂Cg (T8) likewise no significant differences (P>0.05) was shown in the final mean length of the control, F1 progenies produced through breeding combination of ♀Cg x ♂Cg with 0μl (T1) of the genomic DNA inclusion and F1 progenies produced through hybridization combination of ♀Cg x ♂Cg (T6). The mean weight gain as shown in Table 1 was higher in F1 progenies produced through hybridization combination of ♀Hb x ♂Cg (T8) which recorded the of 1346.7g followed by F1 progenies produced through hybridization combination of ♀Cg x ♂Hb (T7) with 1128.3g then F1 progenies produced through breeding combination of ♀Cg x ♂Cg with 30μl of genomic DNA inclusion (T4) having the value of 1028.7g. F1 progenies produced through breeding combination of ♀Cg x ♂Cg with 20 (T3), 40 (T5) and 10μl (T2) of genomic DNA inclusion had the values of 777.3, 577.5 and 550.8g respectively. The control treatment that is F1 progenies produced through breeding combination of ♀Cg x ♂Cg with 0μl (T1) of genomic DNA inclusion recorded the lower value of the mean weight gain of 219.3g while F1 progenies produced through hybridization combination of ♀Cg x ♂Cg (T6) recorded the least value of 198.3g. There was a significant difference (P<0.05) in the mean weight gain of the F1 progenies produced through hybridization combination of ♀Hb x ♂Cg (T8) and the other treatments. Similarly, there was a significant difference (P<0.05) in the mean weight gain of the F1 progenies produced through breeding combination of ♀Cg x ♂Cg with 20 μl (T3) of genomic DNA inclusion and with the other treatments. There was no significant difference (P>0.05) in the mean weight gain between F1 progenies produced through breeding combination of ♀Cg x ♂Cg with 30μl (T4) of the genomic DNA inclusion and F1 progenies produced through hybridization combination of ♀Cg x ♂Hb (T7), between F1 progenies produced through breeding combination of ♀Cg x ♂Cg with 10 (T3) and 40 μl (T5) of the genomic DNA inclusion as well as between the control treatment that is F1 progenies produced through breeding combination of ♀Cg x ♂Cg with 0 μl (T1) of the genomic DNA inclusion and F1 progenies produced through hybridization combination of ♀Cg x ♂Cg (T6). The mean daily weight gain as shown in Table 1 was higher in F1 progenies produced through hybridization combination of ♀Hb x ♂Cg (T8) which recorded the of 8.86g followed by F1 progenies produced through hybridization combination of ♀Cg x ♂Hb (T7) with 7.42g then F1 progenies produced through breeding combination of ♀Cg x ♂Cg with 30μl of genomic DNA inclusion (T4) having the value of 6.76g. F1 progenies produced through breeding combination of ♀Cg x ♂Cg with 20 (T3), 40 (T5) and 10μl (T2) of genomic DNA inclusion had the values of 5.11, 3.80 and 3.62g respectively. The control treatment that is F1 progenies produced through breeding combination of ♀Cg x ♂Cg with 0μl (T1) of genomic DNA inclusion recorded the lower value of the mean daily weight gain of 1.40g while F1 progenies produced through hybridization combination of ♀Cg x ♂Cg (T6) recorded the least value of 1.30g. There was a significant difference (P<0.05) in the mean daily weight gain of the F1 progenies produced through hybridization combination of ♀Hb x ♂Cg (T8) and the other treatments. Similarly, there was a significant difference (P<0.05) in the mean daily weight gain of the F1 progenies produced through breeding combination of ♀Cg x ♂Cg with 20 μl (T3) of genomic DNA inclusion and with the other treatments. There was no significant difference (P>0.05) in the mean daily weight gain between F1 progenies produced through breeding combination of ♀Cg x ♂Cg with 30μl (T4) of the genomic breeding combination of ♀Cg x ♂Cg with 30μl (T4) of the genomic DNA inclusion and F1 progenies produced through hybridization combination of ♀Cg x ♂Hb (T7), between F1 progenies produced through breeding combination of ♀Cg x ♂Cg with 10 (T3) and 40 through breeding combination of ♀Cg x ♂Cg with 10 (T3) and 40 μl (T5) of the genomic DNA inclusion as well as between the control treatment that is F1 progenies produced through breeding combination of ♀Cg x ♂Cg with 0 μl (T1) of the genomic DNA inclusion and F1 progenies produced through hybridization combination of ♀Cg x ♂Cg (T6). The specific growth rate as shown in Table 1 was higher in F1 progenies produced through hybridization combination of ♀Hb x ♂Cg (T8) which recorded the of 2.07% followed by F1 progenies produced through hybridization combination of ♀Cg x ♂Hb (T7) with 2.05% then F1 progenies produced through breeding combination of ♀Cg x ♂Cg with 30μl of genomic DNA inclusion (T4) having the value of 2.00%. F1 progenies produced through breeding combination of ♀Cg x ♂Cg with 20μl (T3) of genomic DNA inclusion had the value of 1.93% while F1 progenies produced through breeding combination of ♀Cg x ♂Cg with 40 (T5) and 10μl (T2) of genomic DNA inclusion produced the specific growth rate of 1.87% each. The control treatment that is F1 progenies produced through breeding combination of ♀Cg x ♂Cg with 0μl (T1) of genomic DNA inclusion recorded the lower value of 1.67% while F1 progenies produced through hybridization combination of ♀Cg x ♂Cg (T6) recorded the least value of 1.62%. There was no significant difference (P>0.05) in the specific growth rate of F1 progenies produced through breeding combination of ♀Cg x ♂Cg with 30 (T4) of genomic DNA inlusion and the F1 progenies produced through hybridization combination of ♀Ca x ♂Hb (T7) and ♀Hb x ♂Cg (T8). There was also no significant difference (P>0.05) in the specific growth rate between F1 progenies produced through breeding combination of ♀Cg x ♂Cg with 20μl (T3) and 30μl (T4) of the genomic DNA inclusion. The F1 progenies produced through breeding combination of ♀Cg x ♂Cg with 10μl (T2), 20μl (T3) and 40μl (T5) of the genomic DNA inclusion showed no significant difference (P>0.05) in the specific growth rate. Subsequently, the control treatment that is, the F1 progenies produced through breeding combination of ♀Cg x ♂Cg with 0μl (T1) of the genomic DNA inclusion and F1 progenies produced through hybridization combination of ♀Cg x ♂Cg (T6) also presented no significant difference (P>0.05). The feed conversion ratio was higher (2.37) in F1 progenies produced through hybridization combination of ♀Cg x ♂Cg (T6) having the value of 2.06 followed by the control treatment that is, the F1 progenies produced through breeding combination of ♀Cg x ♂Cg with 0μl (T1) of the genomic DNA inclusion having the value of 2.06. F1 progenies produced through breeding combination of ♀Cg x ♂Cg with 40μl (T5) of genomic DNA inclusion revealed the value of 1.03. F1 progenies produced through breeding combination of ♀Cg x ♂Cg with 10μl (T2), 20μl (T3) of genomic DNA inclusion and F1 progenies produced through hybridization combination of ♀Cg x ♂Hb (T7) displayed 0.93, 0.73 and 0.60 respectively as the feed conversion ratio. Lower feed conversion ratio (0.57) was recorded in F1 progenies produced through breeding combination of ♀Cg x ♂Cg with 30μl (T4) of genomic DNA inclusion but the least value of the feed conversion ratio (0.50) was in F1 progenies produced through hybridization combination of ♀Hb x ♂Cg (T8). The feed conversion ratio of F1 progenies produced through breeding combination of ♀Cg x ♂Cg with 0 μl (T1) of the genomic DNA inclusion and F1 progenies produced through hybridization combination of ♀Cg x ♂Cg (T6) showed no significant difference (P>0.05). There was no significant differences (P>0.05) was also seen in the feed conversion ratio of F1 progenies produced through breeding combination of ♀Cg x ♂Cg with 10 (T2), 20 (T3) and 40μl (T5) of the genomic DNA inclusion. Similarly, There was no significant differences (P>0.05) was also oberved in the feed conversion ratio of F1 progenies produced through breeding combination of ♀Cg x ♂Cg with 10 (T2), 20 (T3) and F1 progenies produced through hybridization combination of ♀Cg x ♂Hb (T7). Subsequently, no significant differences (P>0.05) was also observed in the feed conversion ratio of F1 progenies produced through breeding combination of ♀Cg x ♂Cg with 20 (T3), 30 (T4) and F1 progenies produced through hybridization combination of ♀Cg x ♂Hb (T7) and ♀Hb x ♂Cg (T8). At the end of the experiment as shown in Table 1, the F1 progenies produced through hybridization combination of ♀Hb x ♂Cg (T8) recorded the protein efficiency ratio of 22.43 followed by F1 progenies produced through hybridization combination of ♀Cg x ♂Hb (T7) with 18.80 then F1 progenies produced through breeding combination of ♀Cg x ♂Cg with 30μl of genomic DNA inclusion (T4) having the value of 17.17. F1 progenies produced through breeding combination of ♀Cg x ♂Cg with 20 (T3), 40 (T5) and 10μl (T2) of genomic DNA inclusion had the values of 12.97, 9.60 and 9.17respectively. The control treatment that is F1 progenies produced through breeding combination of ♀Cg x ♂Cg with 0μl (T1) of genomic DNA inclusion recorded lower value of the protein efficiency ratio as 3.63 while F1 progenies produced through hybridization combination of ♀Cg x ♂Cg (T6) recorded the least value of 3.30. There was a significant difference (P<0.05) in the protein efficiency ratio of the F1 progenies produced through hybridization combination of ♀Hb x ♂Cg (T8) and the other treatments. Similarly, there was a significant difference (P<0.05) in the protein efficiency ratio of the F1 progenies produced through breeding combination of ♀Cg x ♂Cg with 20 μl (T3) of genomic DNA inclusion and with the other treatments. There was no significant difference (P>0.05) in the protein efficiency ratio between F1 progenies produced through breeding combination of ♀Cg x ♂Cg with 30μl (T4) of the genomic DNA inclusion and F1 progenies produced through hybridization combination of ♀Cg x ♂Hb (T7), between F1 progenies produced through breeding combination of ♀Cg x ♂Cg with 10 (T3) and 40 μl (T5) of the genomic DNA inclusion as well as between the control treatment that is F1 progenies produced through breeding combination of ♀Cg x ♂Cg with 0 μl (T1) of the genomic DNA inclusion and F1 progenies produced through hybridization combination of ♀Cg x ♂Cg (T6). At the end of the experiment as shown in Table 1, the F1 progenies produced through hybridization combination of ♀Hb x ♂Cg (T8) recorded the higher mean percentage survival of 86.67% followed by F1 progenies produced through breeding combination of ♀Cg x ♂Cg with 20μl of genomic DNA inclusion (T3) and F1 progenies produced through hybridization combination of ♀Cg x ♂Cg (T6) with 83.33% each then F1 progenies produced through breeding combination of ♀Cg x ♂Cg with 10μl of genomic DNA inclusion (T2) having the value of 80.00%. F1 progenies produced through breeding combination of ♀Cg x ♂Cg with 0 (T1) which is the control, 30 (T4) of genomic DNA inclusion and F1 progenies produced through hybridization combination of ♀Cg x ♂Hb (T7) recorded lower value of 76.67% of the mean percentage survival each. Least value of percentage survival of 70.00% was observed in F1 progenies produced through breeding combination of ♀Cg x ♂Cg with 40μl (T5) of genomic DNA inclusion. There was no significant differences (P>0.05) in the percentage survival among all the treatments and the control.
Discussion
Growth Performance of F1 Progenies Produced through Genomic DNA and Hybridization between Clarias galmeansis and Heterobranchus bidorsalis
The growth performance of the F1 progenies produced through breeding combination of ♀Cg x ♂Cg with 0 (T1), 10 (T2), 20 (T3), 30 (T4) and 40μl (T5) of the genomic DNA inclusion and F1 progenies produced through hybridization combination of ♀Cg x ♂Cg (T6), ♀Cg x ♂Hb (T7) and ♀Hb x ♂Cg (T8) indicated that the initial mean weight (84.93 -72.70g) and initial mean length (620.0 – 530.0mm) were not significantly different (P>0.05) among the experimental treatments and the control showing uniformity in sizes of the fish at onset of the experiment which in turn indicating the accuracy of the randomization process among the experimental treatments and the control. The best growth performance observed in F1 progenies produced through hybridization combination of ♀Hb x ♂Cg (T8) such as final mean weight (1426.3), mean weight gain (1346.7g), mean daily weight gain (8.86g), percentage weight gain (94.38%) and specific growth rate (2.07%/day) are due to the effect of Heterobranchus bidorsalis growth gene as it growth bigger and faster than Clarias galmeansis. The lower growth parameters recorded in the other treatments might be due to low integration of the genomic DNA of the Heterobranchus bidorsalis into the oocyte of the eggs during the fertilization. Lower final mean weight were reported by Buwono et al. [11], who reported the value of 130.62g on transgenic mutiara catfish on his studies on growth hormone transgenesis and feed composition influence growth and protein and amino acid content in transgenic G3 mutiara catfish (Clarias gariepinus). Hurai et al. [24], presented the final weight of 0.09kg on their research on the ability of fast growing transgenic African catfish on predator avoidance. Samira and El Zaeam [25], also documented lower final body of 18.87g of fish after injecting shark DNA at different doses. Contrary to the previous authors, Wang [26], opined the final weight of 2.7kg at 4 month of age for transgenic carp than non-transgenic ones who weight 1.4kg. He further reported the weight of 7.67kg at 17 month of the same fish. Yaping et al. [15], also reported higher values of the final weight of transgenic Cyprinus carpo as 5.58kg in term of body weight in their study on genetic analysis of all fish growth hormone gene transferred to common carp and its generation. Kurdiano et al. [17], reported the higher final weight of transgenic fish as 9.23kg on their research on growth, survival, and body composition of transgenic common carp (Cyprinus carpio) 3rd generation expressing tilapia growth hormone cDNA. Iskhandir et al. [12], reported higher weight gain of Mutiara catfish as 4.74g after working on the growth performance of F1 transgenic mutiara catfish. The weight gain of 55kg was reported by on Growth rate, body composition and feed digestibility conversion of growth-enhanced transgenic Atlantic salmon (Salmo salar). Lower value of the weight gain was reported by Owodiende et al. [13], as 78.72g on F1 hybrid of Clarias gariepinus x Heterobranchus bidorsalis in earthen pond. Similarly, lower weight gain of 36g was documented by Ha and Dong [18], after working on growth performance of transgenic mud loach (Misgurnus mizolepis) carrying a GH transgene driven by mud loach c-type lectin regulator. Contrary to the present work, lower specific growth rate were reported by some authors such as Adeniyi [27], reported 1.29% per day as specific growth rate of Clarias gareipinus fed feed containing lemongrass, El- Zaeem [28], reported the specific growth rate The range between 1.32 - 1.57%/day when produced extraordinary mullet through direct injection with foreign DNA, Abdul-Hamid et al. [29], reported specific growth rate for carp to be 0.98% per day when fed with 15% Maize sativa diets. While Meghowor et al. [30], worked on growth performance of wild strain of Clarias gariepinus from Nigeria and reported the specific growth rate of 1.19%/day Satid et al. [31], presented higher specific growth rate for Clarias gariepinus as 5.74%/day on his research on the effect of strains on growth performance of triploid bighead catfish. Subsequently, higher specific growth rate of 2.85%/day was produced by Barde et al. [32], when uses heat treatment to ascertained the growth performance of Clarias gariepinus. Contrary to the present work, lower specific growth rate were reported by some authors such as Adeniyi [27], reported 1.29% per day as specific growth rate of Clarias gareipinus fed feed containing lemongrass, El- Zaeem [28], reported the specific growth rate. The range between 1.32 - 1.57%/day when produced extraordinary mullet through direct injection with foreign DNA, Abdul-Hamid et al. [29], reported specific growth rate for carp to be 0.98% per day when fed with 15% Maize sativa diets. While Meghowor et al. [30], worked on growth performance of wild strain of Clarias gariepinus from Nigeria and reported the specific growth rate of 1.19%/day. Satid et al. [31], presented higher specific growth rate for Clarias gariepinus as 5.74%/day on his research on the effect of strains on growth performance of triploid bighead catfish. Subsequently, higher specific growth rate of 2.85%/day was produced by Barde et al. [32], when uses heat treatment to ascertained the growth performance of Clarias gariepinus. Feed conversion ratio and mean percentage value of 2.37 obtained in the present study was better than the feed conversion ratio produced by pass authors such as Barde et al. [11], who worked on growth hormone transgenesis and feed composition influence, growth, protein and amino acid content in transgenic G3 mutiara catfish (Clarias gariepinus) and got feed conversion ratio of 0.76. The feed conversion ratio of 0.78 was also documented by Buwono et al. [11], on their research on transgenic mutiara catfish produced with CgGH. Adeniyi [27], produced the feed conversion ratio of 1.4 after feeding transgenic Clarias gariepinus with lemongrass. Higher feed conversion ratio than in the present work were produced by Olude et al. [33], who obtained feed conversion ratio of 2.45 for Clarias gareipinus fish fed diet with 30% copra meal as replacement for soyabean meal. The feed conversion ratio values of Clarias gareipinus fed diet containing cottonseed meal at 75% was 3.91 as reported by Agbo et al [34]. The mean protein efficiency ratio obtained from this research 22.43 was higher than previous authors work such as Olude et al [33], who recorded the protein efficiency ratio of fish fed diet with copra meal at 30% replacement soya bean meal as 1.16, Hassan et al. [35], who worked on the use of Garlic (Allium Sativum) as feed additive on growth performance of African catfish (Clarias gariepinus) reared under indoor condition and reported the protein efficiency ratio of 2.46%. Mohammed et al. [36], on the potential of camel testicles for the growth and survival of masculinized fish opined the protein efficiency ratio of 0.6% and Abdel-Tawwab [37]. After conducting a research on the growth, physiology, antioxidants and immune response of African catfish (Clarias gariepinus) to dietary clover leaf extract and its susceptibility to listeria monocytogenes infection got the Protein efficiency ratio of 1.77. Mean percentage survival of 86.67% gotten from this research is higher than that of Hurai et al. [24], who documented the percentage survival of 47.14% on Clarias gariepinus when work on the ability of fast growing transgenic African catfish on predator avoidance. Lower percentage survival of 40% transgenic fish was also reported by Kurdiano et al [17]. Ha and Dong [18], reported the percentage survival of 68.8% on Misgurnus mizolepis carrying growth hormone and Adeniyi [27], presented higher Percentage survival of 95% on Clarias gariepinus fortified with lemongrass. The difference in the growth performance parameters in this work and the previous researches could be attributed to the effects of hybridization and the genomic DNA used from Heterobranchus bidorsalis.
Monthly Water Quality Parameters during growth performance of Claras galmeansis and Heterobran-chus bidorsalis F1 Progenies Produced through Genomic DNA and Hybridization
The water quality parameters (temperature, dissolved oxygen and hydrogen ion concentration) monitored during the growth performance were at the range of 27.50 - 27.43oC, 5.90 – 5.83mg/l and 7.20 – 7.03 for temperature, dissolved oxygen and hydrogen ion concentration and there was no significant difference (P>0.05) except for pH values. The water quality values obtained during this study are all at optimum range as recommended by Ayodele and Ajani [38], as 3.00-5.00 mg/l, 6.50 – 9.00 and 21-32oC as dissolved oxygen, pH and temperature respectively. The trend line for the dissolved oxygen, hydrogen ion concentration and temperature are all decreasing with increase in in the treatments with the genomic DNA inclusion the decrease in the water quality parameter might brought about by the effect of the genomic DNA and hybridization which increase the body biomass of the fish, as the body increases the the feed consumption also increases and their feacal activies become higher and this affect the water quality parameters.
Conclusion
The growth performance parameters were higher in treatment with ♀Female Heterobranchus bidorsalis x ♂Male Clarias galmaensis (♀Hb x ♂Cg) in terms of final mean weight, mean weight gain, mean daily weight gain, percentage weight gain, feed conversion ratio, protein efficiency ratio and percentage survival as 14.26.3g, 1346.7g, 8.86g, 94.38%, 2.07%, 0.50 and 22.43 respectively. It is concluded that Clarias galmeansis can be improved through both hybridization and inclusion of genomic DNA from Heterobranchus bidorsalis.
Recommendation
Improvement of Clarias galmeansis using hybridization between ♀ Female Heterobranchus bidorsalis x ♂Male Clarias galmaensis (♀Hb x ♂Cg) and breeding combination of ♀ Female Clarias galmaensis x ♂ Male Clarias galmaensis (♀Cg x ♂Cg) with 30μl of the genomic DNA gave better growth parameters. Therefore, it is recommended to fish farmers to employ the used of female Heterobranchus bidorsalis and male Clarias galmaensis while trying to improve the specie or use genomic DNA from Heterobranchus bidorsalis at 30μl to milt from male Clarias galmeansis during artifitial ferti.
References
1. Rahman MA, Ronyai A, Engidaw BZ, Jauncey K, Hwang GL, Smith A, et al. Growth and nutritional trials on transgenic Nile tilapia containing an exogenous fish growth hormone gene. J Fish Biology. 2001; 59: 62-78.
2. Sudha PM, Low S, Kwang J, Gong Z. Multiple tissue transformation in adult zebrafish by gene gun Bombardment and muscular injection of naked DNA. Mar Biotechnol (NY). 2001; 3: 119 - 125.
3. Devlin RHD, Andrade M, Mitchell U, Carlo AB. Population effects of growth hormone transgenic coho salmon depend on food availability and genotype by environment interactions. Proc Natl Acad Sci U S A. 2004; 101: 9303-9308.
4. Adah P, Onyia LU, Obande RA. Fish Hybridization in Some Catfishes: A Review. Biotechnol. 2014; 13: 248-251.
5. Ochokwu IJ, Apollos TG, Oshoke JO. Effect of Egg and Sperm Quality in Successful Fish Breeding. IOSR-JAVS. 2015; 8: 48-57.
6. Aken’Ova TO. A preliminary report on a new species of Clarias Scopoli, 1777 in River Galma, Zaria, Nigeria. J Tropical Biosci. 2007; 7: 45-48.
7. Azeroual A, Entsua-Mensah M, Getahun A, Lalèyè P, Moelants T, Vreven E. “Gymnarchus niloticus”. The IUCN Red List of Threatened Species. IUCN. 2010.
8. Froese R, Pauly D. eds. Fishbase. World Wide Web electronic publication. 2011
9. Pray L. Discovery of DNA structure and function: Watson and Crick. Nature Education. 2008; 1:100
10. Marialuisa L, Marco B, Maria G, Roberto G, Stefano M , Alessia V. Sperm-mediated gene transfer. Reprod Fertil Dev. 2006; 18: 19-23.
11. Buwono ID, Iskandar I, Roffi G. Growth hormone transgenesis and feed composition influence growth and protein and amino acid content in transgenic G3 mutiara catfish (Clarias gariepinus). Aquculture Int. 2021; 29: 1-21.
12. Iskandar, Buwono ID, Mochamad UKA. The growth performance of F1 transgenic mutiara catfish. Conference Series Earth and environment Science. 2018; 137: 012004.
13. Owodeinde FG, Ndimele PE, Jenyo-oni A, Onyenania OB. Survival, growth and feed utilization of the reciprocal hybrids of Clarias gareipinus (Burchell, 1822) and Heterobranchus bidorsalis (Geoffroy, 1809) in concrete tanks. J Fisheries Aquatic sci. 2012; 8: 122-128.
14. Wang Y. Studies on site-specific integration of transgene in trans genic fish. Ph.D. thesis, Institute of Hydrobiology, Chinese Academy of Science (19) (PDF) Growth hormone gene transfer in common carp. 2000.
15. Yaping W, Wei H, Yonghua S, Shangping C, Fuying Z, Zuoyan Z, et al. Genetic analysis of all fish growth hormone gene transferred carp (Cyprinus carpio L.) and its F1 generation. Chinese Sci Bull. 2001; 46: 1174-1177.
16. Huria M, Bambang I, Imron, Slney F, Raden-Rorosripudji SD. The ability of fast growing transgenic African catfish on predator avoidance. Indonesian Aquaculture J. 2016; 11: 9-13.
17. Kurdiano A, Nurly F, Goro Y, Sri N, Mia. Growth, Survival, and Body Composition of Transgenic Common carpcyprinus carpio 3rdgeneration Expressing Tilapia Growth hormone cDNA. HAYATI J Biological Sci. 2016; 23: 150-154.
18. Ha YS, Dong SK. Growth performance of transgenic mud loach Misgurnus mizolepis carrying a GH transgene driven by mud loach c-type lectin regulator. Fisheries Aquatultue Science. 2012; 15: 43-47.
19. Weather and Climate. Climate and Average Weather Year Round in Maiduguri Nigeria. 2020.
20. Mindat.org. Geographical location of River Galma, Zaria Kaduna State. 2022.
21. Busacker GP, Adelman IP, Goolish EM. Growth method for fish Biology. American Fisheries Society. USA. 2012; 363-387.
22. Ahmed MH, Shalaby AME, Khattab YAE, Abdel-Tawwab M. Effects of 17a-methyltestosterone on growth performance and some physiological change of Nile tilapia fingerlings (Oreochromis niloticus). Egypt. Int J Aquatulture Biol Fisheries. 2002; 4: 295-311.
23. Ayoola SO, Akinwole OT, Fredric CA. Effect of the shape of culture tanks on production of catfish Clarias gariepinus. J Agriculture Scientic Res. 2012; 12: 1-8.
24. Huria M, Bambang I, Imron, Slney F. Raden-Rorosripudji SD. The ability of fast growing transgenic African catfish on predator avoidance. Indonesian Aquaculture J. 2016; 11: 9-13.
25. Samira SA, El-Zaeem SY. Application of biotechnology in fish breeding. II: production of highly immune genetically modified redbelly tilapia, Tilapia zillii. African J Biotechnol. 2005; 4: 449-459.
26. Wang Y. Studies on site-specific integration of transgene in trans-genic fish. Ph.D. thesis, Institute of Hydrobiology, Chinese Academy of Science (19) (PDF) Growth hormone gene transfer in common carp. 2020.
27. Adeniyi OV. Growth performance of Clarias gariepinus (Burchell, 1822) Fed Diets Fortified with Lemongrass (Cymbopogon citratus). Acta Vetenerian Eurasia. 2020; 46: 15-23.
28. El-Zaeem SY, Amer TN, El-Tawil, NE. Evaluation of the productive performance characteristics of red tilapia (Oreochromis specie) injected with shark DNA into skeletal muscles and maintained diets containing different levels of probiotic and amino yeast. Afr J Biotechnol. 2012; 11: 7286-7293.
29. Abdel-Hamid MSE, Hafiz MK, Saneyeldin MS, Mohammed NB, Ahmed ZIH. Growth performance of grass carp (Cternopharyngodon idella) in earthen ponds as affected by receiving varying feeding inputs. Egyptian J Appl Sci. 2022; 4: 125-146.
30. Megbowon I, Fashina- Bombata HA, Akinwale MMA, Hammed AM. Mojekwu TO. Growth Performance of Wild Strains of Clarias gariepinus from Nigerian Waters. J Fisheries Aquatic Sci. 2014; 9: 252-256.
31. Satid C, Prapansak S, Na-Nakorn U. Effects of strains on growth performances of triploid bighead catfish, Clarias macrocephalus (Günther, 1864). Agriculture and Natural Resources. 2016; 50: 299-300.
32. Barde ZM, Nasir A, Umar HM, Ibrahim Y. Aliyu M. Effects of thermal treatment on growth performance and survival rate of African catfish (Clarias Gariepinus) in Maiduguri, Nigeria. Int J Fisheries Aquatic Studies. 2019; 7: 176-180.
33. Olude OO, Alegbeleye WOA, Obasa SO. The use of soaked copra meal as a partial substitute for soybean meal in the diet of Nile tilapia (Oreochrormis niloticus) fingerlings. .Livestock Research for Rural Development. 2008; 20: 165-169.
34. Agbo NW, Madalla N. Jauncey K. Effects of dietary cottonseed meal protein levels on growth and nutrient utilization of Nile tilapia (Oreochrormis niloticus). J Appl Sci Environmental Management. 2011; 15: 235-239.
35. Hassan M, Suleiman SB, Ndirmbita WL, Mshelia MB, Usman A, Mohammed ZB. Use of Garlic (Allium Sativum) as Feed Additive on Growth Performance of African Catfish (Clarias gariepinus Burchell, 1822) Reared under Indoor Condition. Int J Pure Applied Sci Res. 2016; 11: 25-31.
36. Mohammed ZB, Umar HM, Suleiman SB, Hassan M, Aliyu M. The potential of camel testicles for the growth and survival of masculinized nile tilapia (Oreochromis niloticus, Linneeus 1758). FUW Trends in Science and Technology J. 2017; 2: 899-901.
37. Abdel-Tawwab M, Adeshina I, Jenyo-Oni A, Ajani EK, Emikpe BO. Growth, physiological, antioxidants, and immune response of African catfish, Clarias gariepinus (B.), to dietary clove basil, Ocimum gratissimum, leaf extract and its susceptibility to Listeria monocytogenes infection. Fish Shellfish Immunol. 2018; 78: 346-354.
38. Ayodele IA, Ajani EK. Essential of fish farming . Publication of Odua printing Ltd. Ibadan. 1999; 359.