Original Article | Volume 4 - Issue 1 | Article DOI :
Download PDF
Ebango Ngando Narcisse1,2, Mboglen David3, Liming Song4,*, Chenhong Li1 and Ntyam Sylvie Carole3
1College of Fisheries and Life Science, Shanghai Ocean University, Shanghai 201306, P.R. China
2Institute of Fisheries and Aquatic Sciences, University of Douala, Yabassi, Cameroon
3Ministry of Scientific research and Innovation, IRAD Kribi, Cameroon
4College of Marine Sciences, Shanghai Ocean University, Shanghai 201306, P.R. China
Corresponding Author:
Liming Song, College of Marine Sciences, Shanghai Ocean University, Shanghai, P.R. China, Tel: 021-61900311
Keywords
biological parameters; Cynoglossus senegalensis; beach perimeters; beach seine; coastal waters; Cameroon
Abstract
Cynoglossus senegalensis (Kaup, 1958) is a valuable species in the artisanal fisheries and has been identified as overexploited in many African countries. The main aim of this study is to determine its basic biological knowledge on the exploitation status in terms of length-weight relationship (LWR), condition factor, and the depth of information on size structure in the Cameroonian coast. A total of 553 samples were collected monthly from March 2021 to February 2022 from beach seine catches along the coastal waters off the south coast of Cameroon. The collected samples were analyzed for growth patterns using Excel 2016 in PC windows 10. The results showed: (1) LWR was W=0.0042(TL)3.0038 indicating an isometric growth pattern (R2=0.9844, t-Test, P>0.05, df=552); (2) a mean Fulton’s condition factor K=0.43 indicating that fishes were not in good condition; (3) a year-round presence of C. senegalensis with highest number of fishes in April and a lowest in August; (4) a trimodal size distribution with a highest length frequency class of ]8~10] and a lowest class of ]2~4]. The results suggest that: (1) the south coast of Cameroon might be a nursery and spawning areas for C. senegalensis; (2) the fishery perimeters of the beach are concentrated mostly on juveniles and immature specimens. The findings would be useful for fishery biologists and fishery managers in future studies on the population dynamics, the stock assessment, the sustainable management and the impact of fishing gear on the C. senegalensis. Our results will contribute to filling the knowledge gap of C. seneglensis in the south coast of Cameroon.
Citation
Ebango NN, Mboglen, Liming S, Chenhong L, Ntyam SC (2022) Length weight relationship, condition factor and length distributions of Cynoglossus senegalensis (Kaup, 1958) off the south coast of Cameroon Int J Fisheries Sci Res 4: 10.
Abbreviations
LWR: length-weight relationship; C. senegalensis: Cynoglossus senegalensis
Introduction
Off the tropical Atlantic coast of Africa, Cynoglossus senegalensis has been identified mainly along the coastal waters [1,2]. It is a demersal, brackish, marine fish living in the depth range of 10 ~110 m [3,4]. It distributed along the coastline from Mauritania to Angola [5,6]. Its stock has been identified as overexploited in many African countries and it has been listed as Near Threatened by the International Union for Conservation of Nature and Natural Resources Red List of Threatened Species since 2015 [2, 7]. Biological studies of species are very important tools for the level of human exploitation, the stock assessment, population dynamics and the fishery resource management in fisheries science.
The length-weight relationship of fish is an important fishery indicator of the fish population. Length-weight relationship provides the mean of the condition factor and valuable information on the habitat where the fish lives [8, 9]. The condition factor is another important indicator to understand the wellbeing of fish and has been used as an index of growth and feeding intensity [8,10]. The condition factor is based on the hypothesis that heavier fish of a given length are in better condition [11,12]. Length frequency distribution of fish is also a very useful tools in many aspects of fisheries sciences such as biomass estimation and the gear selectivity. It shows the number of fish collected in various length categories. It provides deep knowledge on the status of the size structure of natural fish population [13]. It is the first step to evaluate gear selectivity of catches made by different kinds of gear fished in the same water [14].
Knowing that tropical coasts are poorly studied and that fundamental knowledge of these ecosystems related to fish species is still incomplete; recently several researches have been focused on the C. senegalensis along the West Africa coast. Abowei (2009) has reported that the high catch of C. senegalensis was more abundant in the dry season (from December to next January); their high condition factor value (1.5) was recorded in May and the lowest (0.5) in September; and their exponential equation was Wt=0.0326(TL)3.066 indicating an isometric growth pattern at the Nkoro River in Nigeria [4]. Abowei et al. (2009) reported a positive allometric growth of C. senegalensis with W=0.0326(TL)3.508 and an average condition factor of 1.10 indicating that fish were in good condition (K#0.5) from Nkoro River in Niger Delta, Nigeria [15]. Ndome and Eteng (2011) have reported a negative allometry (b=2.0000) of C. senegalensis from the East Coast of Niger delta, Nigeria [16]. Sanyang et al (2011) reported an isometric growth of C. senegalensis with b = 3.00 and a condition factor (range: 0.45~1.63, mean: 0.77) from the Gambia [17]. Udo et al. (2014) has reported that their highest catch obtained was recorded in the month of July with no catch recorded in September; their highest monthly condition factor (0.36) was recorded in November while the lowest (0.28) in June in the estuarine swamps of the Cross River estuary in Nigeria. Akanse and Eyo (2018) has found a negative allometric growth (b = 2.3861) indicating that the fish gets slimmer as it grows larger, a highest condition factor (0.419) in May and a lowest condition (0.277) in November and a highest length frequency between 57.1 cm and 60.0 cm and lowest length frequency between 33.1 cm and 36.0 cm at Akpa Yafe River in Nigeria. The author also reported the exponential equation W =0.0413(TL)2.3861. Cynoglossus senegalensis has been studied by various authors in the Gulf of Guinea as presented in Table 1.
Table 1: Some biological parameters from the literature in the Gulf of Guinea.
| Source |
Study area |
a |
b |
R2 |
K |
| Ecoutin and Albaret (2003) [18] |
Saloum, Senegal |
3.91E-05 |
2.625 |
0.882 |
- |
| Ecoutin et al. (2005) [19] |
Gambia estuary |
- |
2.95 |
0.979 |
0.382 |
| Abowei (2009) [4] |
Nkoro River in Nigeria |
0.0326 |
3.066 |
- |
1 |
| Abowei et al. (2009) [15] |
Nkoro River in Niger Delta, Nigeria |
0.0326 |
3.508 |
- |
1.1 |
| Ndome and Eteng (2011) [16] |
East Coast of Niger delta, Nigeria |
0.056234 |
2 |
0.76 |
1.85 |
| Sanyang et al. (2011) [17] |
Gambia, Gambia-Senegal Sustainable Fisheries Project (BaNafaa) |
0.014736 |
3 |
- |
0.77 |
| Soyinka and Ebogbo (2012) [20] |
Epe Lagoon, Nigeria |
0.64 |
0.819 |
0.76 |
1.03 |
| Udo et al. (2014) [21] |
Cross River Estuary, Nigeria |
- |
- |
- |
0.31 |
| Bolarinwa and Popoola (2014)[22] |
Ibeshe Waterside, Lagos Lagoon, Nigeria |
0.042658 |
2.37 |
- |
0.85 |
| Ndiaye et al. (2015) [23] |
Saloum Delta, Senegal |
0.007 |
2.84 |
0.98 |
- |
| Akanse and Eyo (2018) [13] |
Akpa Yafe River in Nigeria |
0.0413 |
2.3861 |
0.77 |
0.347 |
| Alarape (2019) [24] |
Epe Lagoon, Lagos State |
- |
3.4 |
0.97 |
1.95 |
| Amponsah et al. (2021) [25] |
Coastal waters of Greater Accra, Ghana. |
0.005 |
2.97 |
0.983 |
- |
| Sadio et al. (2021) [26] |
Sine Saloum estuary, Senegal, West Africa |
0.005 |
2.9209 |
0.99 |
- |
| Sadio et al. (2022) [27] |
Fatala estuary in the republic of Guinea |
0.002 |
3.1322 |
0.989 |
- |
| Alain et al. (2022) [28] |
Azagny National Park (ANP) in southwestern Ivory Coast |
0.022 |
2.845 |
0.766 |
2.136 |
Unfortunately, no work has been done on length-weight relationship, condition factor and length frequency of this species from Cameroonian coastline. The main objective was to determine their basic biological knowledge on the exploitation status in terms of their LWR and condition factor, the depth of information on size structure and extend their scientific interest in the Cameroonian coasts with the view of obtaining information required for the management of the resource.
Materials and methods
Study area and sampling sites
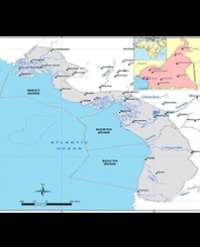
From 1st February 2021 to 31st January 2022, a survey was conducted in the south coast of Cameroon between 2°20′~3°20′N and 9°49′~10°02′E. The area is a part of South region of Cameroon and covers the entire southern zone of the coastline. The area is exploitable by marine artisanal fisheries within the 3 nautical mile limit, which are banned to industrial vessels [29]. The beach area is highly exploited at the beach perimeters using beach seine and gillnets by local people for the subsidence and commercial purposes. For this study, seventeen (17) sampling stations were selected due to their accessibility to the beach perimeters along the coast (Figure 1).

Figure 1: Sampling stations of beach seine.
The area is economically important, rich in fish biodiversity and has several industry activities such as port, oil and gas exploitation, and agricultural activities.
Data collection
During our field survey of twelve months, we have collected weekly samples from beaches, excepted in weeks when weather conditions were not favorable for fishing or no catches (Table 2). The beach perimeter was ready during morning between 7 am and 11 am, and the operations were carried out in general 45 minutes depending on the condition of the deep currents, on the towing speed and the mass of the capture in the cod end. The fishing took place in depths 0~10 m. The configuration of a beach perimeter was with a total length of approximately 550 m, a mesh size of the cod end of 15 mm. The identification of each species was based on identification key given by Menon (1977) (Figure 2) [1].

Figure 2: Outline drawing of C. senegalensis (BMNH 1896.5.5.51) from Igowe River, Lambarene [1]
Table 2: Monthly data collected from the beach seine.
| Month |
Number |
TL range (cm) |
Mean TL±SE |
W range (g) |
Mean W±SE |
| January |
47 |
6.80 ~ 34.60 |
17.31±1.41 |
1.04 ~ 186.40 |
44.61±8.32 |
| February |
59 |
7.4 ~ 32.20 |
19.13±0.92 |
2.27 ~ 151.03 |
42.79±4.91 |
| March |
48 |
6.20 ~ 26.40 |
14.21±0.80 |
1.38~ 82.23 |
18.22±2.87 |
| April |
135 |
7.90 ~ 27.40 |
17.20±0.37 |
1.88 ~ 89.87 |
26.40±1.64 |
| May |
39 |
5.70 ~26.00 |
12.01±0.74 |
0.59 ~ 63.87 |
9.21±1.83 |
| June |
34 |
3.50 ~20.40 |
12.92±0.66 |
0.96 ~ 32.59 |
11.32±1.40 |
| July |
28 |
8.30 ~ 30.00 |
15.20±1.05 |
2.22 ~ 132.00 |
22.60±5.58 |
| August |
25 |
9.10 ~ 30.90 |
20.93±1.38 |
2.69 ~ 116.11 |
50.65±6.98 |
| September |
38 |
5.10 ~ 23.10 |
10.03±0.56 |
0.55 ~ 45.86 |
5.56±1.36 |
| October |
31 |
10.20 ~ 25.80 |
18.84±0.86 |
5.04 ~ 72.93 |
34.39±3.66 |
| November |
43 |
7.20 ~ 25.50 |
17.06±0.76 |
1.58 ~ 86.42 |
27.83±3.17 |
| December |
26 |
8.10 ~21.70 |
14.15±0.68 |
2.01~ 45.86 |
17.44±2.13 |
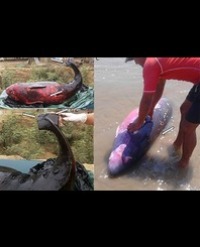
C. senegalensis was distinguished by the presence of a long hook on the snout over hanging the mouth, and the absence of pectoral fins. Their eyes are both on the left side of their body which also lacks a pelvic fin [21].
After collection, the samples were conserved in ice packed containers and transported to “The Laboratory of the Fisheries and Oceanographic Research Station (IRAD) of the Ministry of Scientific Research and Innovation” at Kribi for further analysis. A total of 553 samples of C. senegalensis were collected and the following biometric parameters were recorded: total weight (W) in grams (g), total length (TL) in centimeters (cm) (Table 2). Fishes were measured individually to the nearest 0.1 cm using digital Vernier caliper for the total length and to the nearest 0.01g using digital balance for the total weight.
Data analysis
The length-Weight relationships were obtained using power regression (exponential curve) and expressed by the following classical equation (1) [30]:

where W is the total weight of fish in grams (g); TL is the total length of fish in centimeters (cm); a and b are regression constant (intercept) and regression coefficient (allometry coefficient or slope), respectively [31]. The values of constant a and b were estimated by linear regression model using the logarithmic form following the equation (2) [32]:

The correlation (R2), that is the degree of association between the length and weight was computed from linear regression analysis. Departure from isometry (i.e., b = 3) for the exponents (b) of the length-weight relationship was tested using a t-statistic function given in according to Pauly (1983).
Condition factors have various types of condition factors [33, 13]. One of them is the Fulton’s condition factor K based on cube law:

where K is the condition factor, and 3 is a constant. Another type of condition factor is the relative condition factor, designated as Kn, which follows the formula [34]:

In practice, the length-weight relationship would first be calculated by the logarithm formula (2) and the smoothed mean weight W, for each length computed from this log formula. Thus, the relative condition factor was calculated from the formula:

where W is the calculated weight derived from the length-weight relationship (Cren, 1951).
The data from samplings were grouped into length classes of 2 cm interval for the length frequency distribution [35, 36]. All the statistical analysis were performed in Microsoft Office Excel 2016 in PC windows 10.
Results
Length-weight relationships of C. senegalensis
From the sample size of 553 specimens, the relationships between total length and total weight was W=0.0326(TL)3.508 with a = 0.0042 and b = 3.004 indicating an isometric growth pattern (Figure 3).

Figure 3: Length-weight relationships of C. senegalensis caught from the beach seine in the south coast of Cameroon.
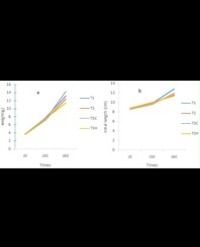
The log transformation of length and weight gave a linear growth as LgW=3.004 Lg(TL)-2.3746 and the t-statistic showed that b = 3.004 is not significantly different from b = 3 (R2=0.9844, t-Test, P>0.05, df=552). The growth curves of Cynoglossus Senegalensis estimated from various authors in the Gulf of Guinea has been presented in Figure 4.

Figure 4: Comparison of growth curves of Cynoglossus Senegalensis estimated from several authors in the Gulf of Guinea.
The comparison of growth curves showed that the present study is between various authors related to isometric and allometric (positive and negative) growth patterns.
Mean of monthly condition factor of C. senegalensis
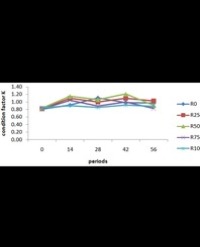
From the sample size of 553 specimens, the mean of monthly condition factor was shown in Table 3. The mean of Fulton’s condition factor K and relative condition factor Kn values were 0.43 and 1.01, respectively. Both mean monthly condition factors showed same trend and changes over the months (Figure 5).

Figure 5: Distribution of the monthly mean condition factors K and Kn from beach seine.
Table 3: Some biological parameters from the literature in the Gulf of Guinea.
| Month |
Number |
K (range) |
Mean K±SE |
Kn (range) |
Mean Kn±SE |
| January |
47 |
0.33~0.84 |
0.44±0.01 |
0.78 ~ 1.98 |
1.02±0.03 |
| February |
59 |
0.34~0.75 |
0.44±0.01 |
0.80 ~ 1.75 |
1.04±0.02 |
| March |
48 |
0.29~0.8 |
0.43±0.01 |
0.67 ~1.37 |
1.01±0.02 |
| April |
135 |
0.32~0.64 |
0.43±0.00 |
0.74 ~ 1.51 |
1.02±0.01 |
| May |
39 |
0.27~0.55 |
0.39±0.01 |
0.64 ~1.29 |
0.92±0.03 |
| June |
34 |
0.12~2.23 |
0.48±0.05 |
0.28 ~ 5.26 |
1.13±0.13 |
| July |
28 |
0.38~0.62 |
0.44±0.01 |
0.88 ~ 1.46 |
1.02±0.02 |
| August |
25 |
0.34~0.51 |
0.41±0.01 |
0.79 ~ 1.19 |
0.97±0.02 |
| September |
38 |
0.33~0.47 |
0.39±0.01 |
0.78 ~ 1.10 |
0.92±0.01 |
| October |
31 |
0.37~0.55 |
0.44±0.01 |
0.87 ~ 1.30 |
1.04±0.02 |
| November |
43 |
0.38~0.55 |
0.45±0.01 |
0.90 ~ 1.28 |
1.04±0.01 |
| December |
26 |
0.38~0.54 |
0.43±0.01 |
0.89 ~ 1.26 |
1.02±0.02 |
| Total |
553 |
Mean K±SE |
0.43±0.007 |
Mean Kn±SE |
1.01±0.016 |
K and Kn from the beach perimeter in the south coast of Cameroon showed the highest condition factors values of 0.48 and 1.13 recorded in June and the lowest value of 0.39 and 0.92 recorded in May and September, respectively. The condition factors distribution showed: (1) a significant increase from May to June (0.39~0.48 or 0.92~1.13) and from September to October (0.39~0.44 or 0.92~1.04); (2) a significant decrease from April to May (0.43~0.39 or 1.02~0.92) and from June to September (0.48~0.39 or 1.13~0.92); and (3) a no significant variation from October to April (0.42~0.44 or 1.01~1.04).
Length-frequency distributions
The number of fish specimens obtained from the south coast of Cameroon during the study period were shown in Figure 6.

Figure 6: Sampling size of C. senegalensis from beach seine.
The highest number obtained was recorded in the month of April (135) followed by February (59), March (48), January (47), November (43), May (39), September (38), June (34), October (31), July (28), December (26) and August (26). The data were grouped into 17 length classes of 2 cm interval. The representation of the length frequency showed a dominance length class of ]8~10] followed by ]16~18], ]10~12], ]20~22], ]18~20], ]12~14], ]14~16], ]6~8], ]22~24], ]24~26], ]26~28], ]28~30], ]30~32], ]4~6], ]32~34], ]34~36] and ]2~4] (Figure 7).

Figure 7: Distribution of length frequency of C. senegalensis from beach seine.
This study showed a multimodal size distribution with length class of ]8~10] as the maximum peak, followed by the length classes of ]16-18] and ]20-22]. The monthly distribution of length frequency was shown in Figure 8.

Figure 8: Monthly distribution of length frequency of C. senegalensis from beach seine.
The results showed a multimodal size distribution from January to December. The variations in fish length classes showed a high frequency of juveniles and immature specimens, and a low frequency of matured ones from January to December.
Discussion
Length-weight relationships of C. senegalensis
The weight growth of C. senegalensis in the south coast of Cameroon is isometric. The length-weight relationship of C. senegalensis showed that the exponent b value was 3.004 and hence, the weight growth for the species departs not significantly from 3. Our results implies that the species did not increase in weight faster than the cube of their total lengths [4]. It is known that the regression coefficient for isometric growth was 3, and when the values of the coefficient are greater or lesser than 3, the fish growth allometrically [37]. The length-weight relationship is also known to be used in comparing morphological aspects and life history of fish populations inhabiting different water bodies [38, 13]. The present results were comparable with the earlier available studies in the neighboring country like Nigeria in particular and in the Gulf of Guinea in general. The growth curves of Cynoglossus Senegalensis estimated from various authors in the Gulf of Guinea showed that the present study had similar results.
Our results were also consistence with Abowei (2009) at Nkoro River in Nigeria, Sanyang et al. (2011) in Gambia, Amponsah et al. (2021) at Coastal waters of Greater Accra in Ghana, Sadio et al. (2021) at Sine Saloum estuary in Senegal and Sadio et al. (2022) at Fatala estuary in the Republic of Guinea, but in disagreement with the results obtained by Ecoutin and Albaret (2003) at Saloum in Senegal, Ndome and Eteng (2011), Soyinka and Ebogbo (2012) at Epe Lagoon in Nigeria, Bolarinwa and Popoola (2014) at Ibeshe Waterside Lagos Lagoon in Nigeria, Ndiaye et al. (2015) at Saloum Delta in Senegal, Akanse and Eyo (2018) at Akpa Yafe River in Nigeria and Alain et al. (2022) at Azagny National Park in southwestern Ivory Coast. The differences between their findings and our results might be due to differences in ecological conditions of water bodies [39, 40]. Knowledge on the biological parameters is indispensable for the study of population dynamics. Marine benthonic species such as soles are known to prefer soft bottoms such as muddy and sandy bottoms [21]. The coefficient of determination (R²) for length weight relationships is high for C. senegalensis which indicates that the length increases with increase in weight of the fish. This is in agreement with previous studies on different fish species from various water bodies.
Monthly condition factor of C. senegalensis
All the fish samples were not in good condition. In fishery science, the condition factor is based on the hypothesis that heavier fish of a given length are in better condition. In fishery science body wellbeing ≥ 1.0 is considered as good and explanation for the low k-value is unknown [21]. The monthly condition factors K (range: 0.39~0.48; mean: 0.43) and Kn (range: 0.92~1.13; mean=1.01) obtained in this study varied with the results from other studies [4, 21, 13]. The values of Fulton’s condition factor K obtained from our study showed that the fish condition was generally low. Our results were in agreement with Ecoutin et al. (2005) in Gambia estuary, Sanyang et al. (2011) in Gambia, Udo et al. (2014) at Cross River Estuary in Nigeria, Bolarinwa and Popoola (2014) at Ibeshe Waterside Lagos Lagoon in Nigeria and Akanse and Eyo (2018) at Akpa Yafe River in Nigeria; but in disagreement with the results obtained by Abowei (2009) at Nkoro River in Nigeria, Abowei et al. (2009) at Nkoro River in Niger Delta in Nigeria, Ndome and Eteng (2011) at East Coast of Niger delta in Nigeria, Soyinka and Ebogbo (2012) at Epe Lagoon in Nigeria, Alarape (2019) at Epe Lagoon in Lagos State and Alain et al. (2022) at Azagny National Park in southwestern Ivory Coast. The difference might be due to the sampling area and period, the number of samples and the range of the structure size. Factors affecting the well-being of fish can be the sex, the gonad maturity stage, the food availability, the feeding intensity, the climate, the environmental changes and other conditions [31, 37]. However, we found that the relative factor Kn expressed a good condition. It seems that the Fulton’s condition factor K can well express the condition factor of this species than the relative condition factor Kn. The concepts of K and Kn have led to confusion in this study. Other authors have also found the same confusion by trying to better understand their necessity in fish biology science [41].
Both mean monthly condition factors showed same trend and changes over the months. The condition factors distribution of K and Kn showed a significant increase from May to June and from September to October, a significant decrease from April to May and from June to September and a no significant variation from October to April. Variations in condition factor values is an indication of the degree of food source availability, state of sexual maturity and suitability of a specific water body for healthy growth of fish [13]. Sanyang et al. (2011) reported that the dramatical changes in the condition of C. senegalensis must likely due to the spawning event. Akanse and Eyo (2018) reported that the low values of K in fish may be due to poor environmental conditions, reduced availability of food and prey items. C. senegalensis are known to live on sand and mud bottoms of coastal waters and mainly feed on mollusks, shrimps, crabs and fish [4]. However, the presence of algae, plant matter tends to support that C. senegalensis is an omnivore [21].
Length-frequency distributions
The south coast of Cameroon might be a nursery and spawning areas for C. senegalensis. Our study showed the month sampling distribution with highest number of fish obtained in April followed by February, March, January, November, May, September, June, October, July, December and August. Contrary to others authors such as Abowei et al. (2009), Sanyang et al. (2011) and Udo et al. (2014), who reported the absence of sole in several months (May, July, August, September, November), our study reported the presence of C. senegalensis during the twelve months collection in the south coast of Cameroon [4, 21]. The authors were not able to explain the reason of the absence of fish. The presence of fish during the whole year showed that it might be a nursery and spawning areas along the south coast of Cameroon. Ebango et al. (2021) presented the four seasons observed in the southern coast of Cameroon such as a major rainy season from mid-August to November, a major dry season from December to mid-March, a minor rainy season from mid March to June and a minor dry season from July to mid-August [42]. The highest and lowest monthly number or proportion of fish collected in Nigeria and in the south coast of Cameroon were not in agreement in terms of months and seasons. It might be related to the environmental conditions and the definition of seasons by each zone or country. It might also due to the variable sampling effect or population abundance.
The perimeter of the beach fishery is concentrated mostly on juveniles and immature specimens. In terms of length frequency grouped into 17 length classes of 2 cm interval, the results of grouped data showed a highest length frequency class of ]8~10] and a lowest length frequency class of ]2~4]. The results also showed a trimodal size distribution with a maximum length class of ]8~10] followed by the length classes of ]16~18] and ]20~22]. Our results were different to those obtained in Nigeria by Akanse and Eyo (2018). It might due to the target species size by the fishing gear and the fishing ground. The length frequency distribution is fundamental to understand growth, reproduction and recruitment with changes in size as an early indicator of disturbance [43].. This finding has management implication for this resource sustainability in the coastal waters. The length frequency provides deep knowledge on the structure of natural fish population and it is used as first step in fishing technology to assess the selectivity of the fishing gear. It is also as analytical tools for managing and monitoring fisheries size [13]. The reason of the dominance of the juveniles and immature specimens in our study could be due to a low mesh-size selectivity of the beach perimeter fishing gear and the location in a water body where the gear is used.
Suggestions and further research
The recent estimation of catch statistics in the south coast of Cameroon using statistical approaches showed that the area has a high potential for the fisheries research [42]. The identification and a good management of these species in the coastal area is very important because the maintaining of their stocks and their habitats in a favorable state will significantly contribute to the improvement of their stocks. Although we have been able to establish more detailed biological aspects related to the species and area specificities, it is clear that these can be improved in the Cameroonian waters. We then suggested further researches on sex ratios, stomach content, gonad maturity, age at length information in the Cameroonian waters. We also suggest to conduct research on the impact of the beach seine on the biodiversity of species along the south coast of Cameroon.
Conclusion
Our study highlighted basic and crucial information of C. senegalensis on length weight relationship, condition factor and length distribution from south coast of Cameroon. These biological aspects are useful in the fishery exploitation and sustainable management in the coastal area. The findings would be useful for fishery biologists and fishery managers in future studies on the population dynamics, the stock assessment, the sustainable management and the impact of fishing gear on the C. senegalensis. Our results will contribute to filling the knowledge gaps of C. senegalensis in the south coast of Cameroon.
Acknowledgements
We thank Mr. NKONDJE MBELLA Yves the Commandant of Kribi Gendarmerie, Ms. ETOH OTMBO Raissa Sandrine, a current student at the University of Dschang and fishermen for their cooperation and support. Our gratitude is also extended to Pr. Oben Mbeng Lawrence for proofreading this article.
References
[1] Menon, A.G.K.A. Systematic Monograph of the Tongue Soles of the Genus Cynoglossus Hamilton-Buchana (Pisces: Cynoglossidae). Smithsonian Contributions To Zoology, Smithsonian Institution Press, Number 238, Washington, 1977.
[2] Fantong, Z.G.; Nack-Keun K.; Sapto A.; Hyun-Woo K. Characterization of the mitogenome of Cynoglossus Senegalensis (Pleuronectiformes: Cynoglossidae). Mitochondrial DNA Part B. 2018. 3(2), 1191-1192.
[3] FAO. Species identification streets for fisheries purposes. East central Atlantic Fishing Area. 34 and part of 47. Dept of Fish and Oceans. Canada. 1981. Vol. II: pp.1-8.
[4] Abowei, J.F.N. The Abundance, Condition Factor and Length- weight Relationship of Cynoglossus senegalensis (Kaup, 1858) from Nkoro River Niger Delta, Nigeria, Niger Delta. Advanced Journal Of Food Science and Technology. 2009. 1(1), 57-62.
[5] Obiekezie, A.; Lick, R.; Kudoa cynoglossi n. sp., a New Species of KudoaMeglitsch (Myxosporea: Multivalvulida) from the West African Tongue Sole, Cynoglossus senegalensis (Kaup)(Teleostei: Cynoglossidae). Archiv Fur Protistenkunde. 1994. 144, 201-205.
[6] Edwards, .A.J.; Gil, A.C.; Abohweyere, P.O. A revision of Irvine’s marine fishes of tropical West Africa. Marine biodiversity capacity building in the West African Sub-region. Darwin Initiative Report, Report 2, Ref. 162/7/451. 2001. 157.
[7] Adeofe, T.A.; Camara, K.; Camara, Y.H.; Cissoko, K.; Mbye, E.; Munroe, T.; Sidibe, A.; Tous, P.; de Morais, L.; Sagna, A.; Sylla, M. Cynoglossus senegalensis. The IUCN Red List of Threatened Species. 2015: e.T15602947A15604030.
[8] Abowei, J.F.N.; Davies, O.A.; Eli, A.A. Study of the length–weight relationship and condition factor of five fish species from Nkoro River, Niger Delta, Nigeria. Current Research Journal of Biological Sciences. 2009. 1(3), 94-98.
[9] Oni, S.; Olayemi, J.; Adegboye, J. Comparative physiology of three ecologically distinct fresh water fishes, Alestes nurse Ruppell, Synodontis schall Bloch and S. schneider and Tilapia zilli Gervais. Journal of Fish Biology. 1983. 22, 105-109.
[10] Kamelan, T.M.; Berté, S.; Kouamélan, E.P.; N’Douba, V. Length-weight relationships and condition factor of fish species from Taï National Park Basins, Côte d’Ivoire. Journal of Biodiversity and Environmental Sciences. 2014. 5(2), 18-26.
[11] Bagenal, T.; Tesch, A. Conditions and Growth Patterns in Fresh Water Habitats. Blackwell Scientific Publications, Oxford. 1978.
[12] Fagade, S. Observation of the biology of two species of Tilapia from the Lagos lagoon Nigeria. Bull. Inst. Fond Afr.Nore (ser. A). 1979. 4(1), 627-658.
[13] Akanse, N.; Eyo, V. Length-weight Relationship, Condition Factor and Length Frequency Distribution of the Tongue Sole Cynoglossus senegalensis from Akpa Yafe River, Bakassi, Cross River State, Nigeria. Asian Journal of Advances in Agricultural Research. 2018. 6(11), 1-8.
[14] Olagbemide, P. Length Frequency Distribution And Length-Weight Relationship Of Schilbe Mystus From Lekki Lagoon In Lagos, Nigeria. Journal of Agricultural and Veterinary Sciences. 2010. 2.
[15] Abowei, J.F.N.; Davies, O.A.; Eli, A.A. Study of the length–weight relationship and condition factor of five fish species from Nkoro River, Niger Delta, Nigeria. Current Research Journal of Biological Sciences. 2009. 1(3), 94-98.
[16] Ndome, C.; Eteng, A. Preliminary note on the length-weight relationships and condition factor for Cynoglossus browni and Cynoglossus senegalensis (Pisces: Cynoglossidae) off the East Coast of the Niger Delta, Nigeria. World Applied Sciences Journal. 2010. 10(5), 584-589.
[17] Sanyang, L.; Kretsch, A.; Castro, K. Length-weight relationships and condition factors of Red sole, Cynoglossus senegalensis and Black sole, Synaptura cadenati from The Gambia, Rhode. Coastal Resources Center, University of Rhode Island. 2011.
[18] Ecoutin, J. ; Albaret, J. Relation longueur-poids pour 52 espèces de poissons des estuaires et lagunes de l’Afrique de l’Ouest. Cybium. 2003. 27, 3-9.
[19] Ecoutin, J.; Albaret, J.; Trape, S. Length–weight relationships for fish populations of a relatively undisturbed tropical estuary: The Gambia. Fisheries Research. 2005. 72, 347–351.
[20] Soyinka, O.; Ebigbo, C. Species diversity and growth pattern of the fish fauna of Epe Lagoon, Nigeria. Journal of Fisheries and Aquatic Science. 2012. 7(6), 392-401.
[21] Udo, M.; Ayua, G.; Akpan, M.; Umana, S.; Isangedighi, A. Abundance, Condition Factor, Food And Feeding Habits Of The Solefish Cynoglossus Senegalensis In The Cross River Estuary, Nigeria. Nigerian Journal of Agriculture, Food and Environment. 2014. 10(3), 43-48.
[22] Bolarinwa, J.; Popoola, Q. Length-Weight Relationships of Some Economic Fishes of Ibeshe Waterside, Lagos Lagoon, Nigeria. J. Aquac. Res. Development. 2013. 5, 203.
[23] NDIAYE, W.; SARR, A.; DIOUF, M.; FAYE, A.; MBODJI, A. Length-weight relationships of some fish species from the Bandiala River in Saloum Delta, Senegal. Int. J. Adv. Res. 2015. 3, 132-138.
[24] Alarape, A. Growth Pattern And Condition Factor Of Monodactylus Sabae And Cynoglossus Senegalensis In Epe Lagoon, Lagos State. International Journal of Innovation Sciences and Research. 2019. 8(6), 1401-1402.
[25] Amponsah, N.; Commey, N.; Avornyo, S.; Afranewaa, N. Length weight relationships of six marine fish species from the coast of Ghana. J Appl Ichthyol. 2021. 1-3.
[26] Sadio, O.; Le Loc’h, F.; Simier, M. Length-weight relationships of 20 fish species from the Sine Saloum estuary, Senegal, West Africa. Cybium. 2021. 45(2), 155-158.
[27] Sadio, O.; Simier, M.; Le Loc’h, F.; de Morais, L. Length–weight relationships of four fish species from Fatala estuary, Guinea, West Africa. J Appl Ichthyol. 2022. 38, 372-374.
[28] Alain, K.; Silvain, Y.; Marius, K.; Aristide, K. Length-Weight Relationship And Condition Factor Of Mangrove Fish Species In Azagny National Park (Grand-Lahou Department, Ivory Coast). European Scientific Journal (ESJ). 2022. 18(8), 158.
[29] MINEP. The implementation of integrated coastal management (ICM) for the Kribi-Campo area in Cameroun. Environment and Resource Protection Cameroon (ENVI), CMEROON. 2011.
[30] Pauly, D. Some simple methods for the assessment of tropical fish stock. FAO Fish Tech. Pap No.234, Rome. 1983.
[31] Cren, L. The length- weight relationship and seasonal cycle in gonadal weight and condition in the perch (Perca fluviatilis). Journal of Animal Ecology. 1951. 20, 201-219.
[32] Nehemia, A.; Maganira, J.; Rumisha, C. Length-weight relationship and condition factor of tilapia species grown in marine and fresh water ponds. Agriculture and Biology Journal of North America. 2012. 3(3), 117-124.
[33] Hile, H. Age and Growth of the Cisco, Leuctichthys artedi (Le Sueur), in the Lakes of North-eastern High Lands. Wisconsin. Bulletin U.S. Bur.Fishery. 1936. 48, 211-217.
[34] Cren, E. The length-Weight Relationship and Seaonal cycle in gonad weight and condition in the Perch (Perca fluviatilis). J. Anim. Ecol. 1951. 20, 201-219.
[35] Taiwo, O. Length frequency distribution and length-weight relationship of Schilbe mystus from Lekki Lagoon in Lagos, Nigeria. Journal of Agricultural and veterinary Sciences. 2010. 2, 63-69.
[36] Anderson, R.; Neumann, R. Length, weight, and associated structural indices. in, Murphy, B.R. and D.W. Willis, editors Fisheries Techniques, second edition. American Fisheries Society, Bethesda. 1996. 447-481.
[37] Gayanilo, F.; Paaul, D. FAO ICLARM stock assessment tools (FISAT): References manual, FAO Computerized information series (Fisheries). FAO Fisheries & Aquaculture, Rome. 1997.
[38] Stergiou, R.; Moutupoulos, D. A review of length-weight relationships of fish from Greek marine waters. Naga ICLARM Q. 2001. 23-39.
[39] Nehemia, A.M.J.; Rumisha, C. Length-weight relationship and condition factor of tilapia species grown in marine and fresh water ponds. Agriculture and Biology Journal of North America. 2012. 3(3), 117-124.
[40] EYINA, D.; ALABA, O.; OGBONNAYA, I. Length-weight Relationships and Condition Factor of Three Species of Mullet (Mugilidae) in the New Calabar River. Borneo Journal of Resource Science and Technology. 2019. 9(2), 65-71.
[41] Frose, R. Cube law, condition factor and weight–length relationships: history, meta-analysis and recommendations. J. Appl. Ichthyol. 2006. 22, 241-253.
[42] Ebango, N.N.; Mbappe, N.; Liming, S.; Njomoue, P.A.; Chenhong, L.; Tomedi, E.M.T. Catch statistics from artisanal marine fishing: A case of the south coast of Cameroon. African Journal of Fisheries Science. 2021. 9(2), 1-13.
[43] Johnson, M.; Tamatamah, A. Length Frequency Distribution, Mortality Rate and Reproductive Biology of Kawakawa 5Euthynnus affinis Cantor, 1849) in the Coastal Waters of Tanzania. Pakistan Journal of Biological Sciences. 2013. 16(21), 1270-1278.