Research Article | Volume 3 - Issue 1 | Article DOI :
Download PDF
Ramesh1, Appasamy Surendran2 and Antony Joseph Thatheyus1*
1PG and Research Department of Zoology, The American College, India 2PG Department of Food Science & Nutrition, The American College, India
Corresponding Author:
Antony Joseph Thatheyus, PG and Research Department of Zoology, The American College, Madurai, India, Tel:+91 94874 24820
Keywords
Heavy metals; Mercury; Cadmium; Mixture toxicity; Labeo rohita
Abstract
Many industries discharge their effluents in to aquatic ecosystems without proper treatment. As they contain several heavy metals, they affect aquatic organisms. Acute toxicity tests provide rapid estimates of lethal concentrations of toxicants. Hence, the present work has been designed to test the acute toxicity of mercury, cadmium and their combinations to the fingerlings of the Indian major carp, Labeo rohita. Among these four types of toxicants, Hg was the most toxic followed by (Cd)+Hg, (Hg)+Cd and Cd.
Citation
Ramesh, Surendran A and Thatheyus AJ. Mixture Toxicity of the Heavy Metals, Mercury and Cadmium to the Indian Major Carp, Labeo rohita. Int J Fisheries Sci Res. 2019; 3(1): 1012.
Introduction
Water is an integral constituent of all living things and it is the universal biological solvent. Modern industrial and agricultural techniques require the use of many million tones of fertilizers, heavy metals and pesticides. These effluents find their way in to aquatic systems through surface run off from industries or as a result of discharge of these wastes into streams and rivers. They pose constant threat to non-target organisms such as fish and insects and tend to bioconcentrate the inorganic and industrial wastes [1,2]. The industrial complexes have become the focus of environmental pollution [3]. The main pollutant from these industrial complexes is effluent, which contains heavy metals such as Cu, Ni, Zn, Pb, Cr, Hg, Cd and various organic compounds such as phenols and formaldehyde [4]. The recovery of these heavy metals using conventional techniques is neither economical nor eco-friendly [5,6]. Once heavy metals are accumulated by aquatic organisms they can be transferred to higher trophic levels of food chain. Carnivores at the top of the food chain including humans, receive most of their heavy metal burden from aquatic ecosystems by way of their food, especially where fish are present [7].
Studies have shown that even after cessation of the contamination source, heavy metals from sediments can be cycled into natural aquatic systems [8]. The heavy metal concentration in the tissues of aquatic animals is occasionally monitored. The toxicity may be either acute or chronic to fishes in sublethal concentration. Among these two, later concentrations are slow poisons disturbing the biochemistry of the organisms and in fact more dangerous [9].
Chemical and metallurgical industries are the most important sources of heavy metals in the environment [10]. The contamination of aquatic system with heavy metals may have devastating effects on the ecological balance of the aquatic environment and diversity of aquatic organisms becomes limited with extent of contamination [11]. Most of the heavy metals released into the environment find their way into the aquatic phase as a result of direct input, atmospheric deposition and erosion due to rain water. Hence, aquatic organisms are exposed to elevated levels of heavy metals. Cadmium and lead have no known role in biological systems whereas copper and zinc are essential components of enzymes or metalloproteins in fish metabolism. These heavy metals accumulate in the tissues of aquatic animals and may become toxic when accumulation reaches a substantially high level. Accumulation levels vary considerably among metals and species [12].
Fish have numerous advantages as indicator organisms for biological monitoring programs. Fish communities represent a variety of trophic levels (carnivores, herbivores, insectivores, planktivores and piscivores) and include foods of both aquatic and terrestrial origin. Fishes are typically present even in the smallest streams and in all but the most polluted waters. Both acute toxicity and stress effects can be evaluated employing fish [13]. The target organs, such as liver, gonads, kidney and gills have a tendency to accumulate heavy metals in high levels as shown in many species of fish in different areas [14]. Studies have shown that fish are able to accumulate and retain heavy metals from their environment and it has been shown that accumulation of metals in tissue of fish is dependent upon exposure concentration and duration, as well as other factors such as salinity, temperature, hardness and metabolism of the animals [15,16]. The toxic effects occur when excretory, metabolic, storage and detoxification mechanisms are able to counter uptake. In recent years, several authors have investigated the heavy metal accumulation in fish and other organisms [17,18]. The excess copper impairs the survival, growth and reproduction of fish [19]. In this context, the present study has been carried out to estimate the acute toxicity of mercury, cadmium and their mixtures to Labeo rohita.
Materials and Methods
For the present study, the fingerlings of L.rohita were purchased from local aqua farm in Madurai, Tamil Nadu, India. The fish were acclimatized for more than ten days in large aquaculture tanks (75L). The fish were fed with commercially available feed daily. The excreta and excess food were siphoned out to avoid contamination and ammonia stress. Once in a day water was changed. From the laboratory acclimatized fishes, fishes with 5 ± 0.5 cm length and 5 ± 1g were selected and they were again acclimatized for one or two days in experimental tanks prior to commencement of the experiment. The capacity of experimental tank was twenty liters. The tank was closed by net to prevent the jumping of fish.
1.353g of HgCl2 was dissolved in one liter double distilled water to get 1000 ppm of mercury stock solution where as 2.031g of CdCl2 2 ½ H2 O was dissolved in one litre of double distilled water to get 1000 ppm of cadmium stock solution. The ground water was used in the present study. Each tank was filled with five litres of ground water with five fishes.
Determination of LC50
After preparing the stock solutions for mercury and cadmium, the wide range of these two metals were identified by using three fish in each concentration. The fish should not be fed for one day before starting the experiment to avoid the change in toxicity of metals due to excretory products [20]. Then narrow range was identified from wide range. Different concentrations of the metals were prepared and in each of them ten fish were exposed separately. The percent mortality of fish in different concentrations was noted after 24, 48, 72 and 96 hours of exposure. The LC50 value for different exposure periods were obtained after computing probit analysis. In this, the concentrations were converted into log concentrations and percent mortality values were converted into probit scale. Using regression analysis, straight lines were drawn in the graph to derive the LC50 values. Chi- square tests were carried out to test the goodness of fit for comparing the observed Y-values and expected Y- values [21].
Determination of LC50 value for metal mixtures
The combinations of metals were prepared, in which one metal concentration was kept constant (i.e. 1/10th of 96 hr LC50 value) and the other was varied. Different concentrations of metal mixtures were prepared and in each of them ten fishes were exposed separately. The percent mortality of fish in different metal mixture concentration was noted after 24, 48, 72 and 96 hours of exposure. The LC50 values for metal mixtures were obtained employing probit analysis.
Results
The percent mortality values of L.rohita exposed to different concentrations of metals and metal mixtures are given in Table 1 to 4. No mortality was noticed in 0.20 ppm of HgCl2 from 24 hours to 96 hours, while 100% mortality was observed in 0.50ppm of HgCl2 within 24 hours. The LC50 values for 24, 48, 72 and 96 hours were 0.71, 0.65, 0.64 and 0.64 ppm respectively (Table 1). The LC50 values observed decreased with the increase in the duration of exposure to HgCl2 . In Cadmium, no mortality was observed in 40 ppm of CdCl2 in 24 hours of exposure. 100% mortality was noticed in 120ppm of CdCl2 in 24 hours of exposure. The LC50 values for 24, 48, 72 and 96 hours were 141, 88, 81 and 81 ppm respectively (Table 2).
Table 1: Acute toxicity test results of Mercury to L.rohita.
| |
|
95% Fiducial limits of LC50 (ppm) |
Probit regression equation |
Slope |
|
| |
Lethal concentration (ppm) |
Chi-square values |
| |
|
Function |
|
| Hours |
LC5 |
|
|
|
|
|
|
|
|
|
|
|
|
Level of significance at |
| |
|
|
|
|
|
Lower |
Upper |
Y = a+b x |
“S” |
Observed |
Table |
0.05 level |
| LC10 |
LC16 |
LC50 |
LC84 |
LC90 |
LC99 |
|
|
|
|
|
|
|
| |
|
|
|
|
|
|
|
|
|
Y=6.388031 + |
|
|
|
|
| 24 |
0.48 |
0.52 |
0.56 |
0.71 |
0.91 |
0.98 |
1.26 |
0.63 |
0.82 |
9.411891 X |
1.2732 |
20 |
7.81 |
S |
| |
|
|
|
|
|
|
|
|
|
Y=6.65433 + |
|
|
|
|
| 48 |
0.4 |
0.45 |
0.5 |
0.65 |
0.85 |
0.93 |
1.25 |
0.58 |
0.72 |
8.577419 X |
1.3231 |
24.2 |
9.49 |
S |
| |
|
|
|
|
|
|
|
|
|
Y=6.734322 + |
|
|
|
|
| 72 |
0.41 |
0.45 |
0.49 |
0.64 |
0.83 |
0.91 |
1.21 |
0.52 |
0.73 |
8.761884 X |
1.3103 |
17.6 |
9.49 |
S |
| |
|
|
|
|
|
|
|
|
|
Y=6.734322 + |
|
|
|
|
| 96 |
0.41 |
0.45 |
0.49 |
0.64 |
0.83 |
0.91 |
1.21 |
0.59 |
0.7 |
8.761884 X |
1.3103 |
17.6 |
9.49 |
S |
S = Significant; NS = Not Significant.
Table 2: Acute toxicity test results of Cadmium to L.rohita.
| |
|
95% Fiducial limits of LC50 (ppm) |
Probit regression equation |
Slope |
|
| |
Lethal concentration (ppm) |
Chi-square values |
| |
|
Function |
|
| Hours |
|
|
|
|
|
|
|
|
|
|
|
|
|
Level of |
| |
LC5 |
|
|
|
|
|
|
Lower |
Upper |
Y = a+b x |
“S” |
Observed |
Table |
significance at |
| |
|
LC10 |
LC16 |
LC50 |
LC84 |
LC90 |
LC99 |
|
|
|
|
|
|
0.05 level |
| |
|
|
|
|
|
|
|
|
|
Y=-2.085658+ |
|
|
|
|
| 24 |
45 |
57.9 |
70.7 |
141 |
282 |
344 |
712 |
114 |
174 |
3.291838x |
1.9972 |
4.0809 |
9.49 |
NS |
| |
|
|
|
|
|
|
|
|
|
Y=-1.27823 + |
|
|
|
|
| 48 |
28.4 |
36.6 |
44.5 |
88 |
174 |
212 |
435 |
67 |
115 |
3.224158x |
1.9796 |
19.066 |
9.49 |
S |
| |
|
|
|
|
|
|
|
|
|
Y=-8.973124 + |
|
|
|
|
| 72 |
48.6 |
54.4 |
59.4 |
81 |
110 |
121 |
167 |
77 |
85 |
7.325261x |
1.3616 |
5.7321 |
5.99 |
NS |
| |
|
|
|
|
|
|
|
|
|
Y=-8.973124 + |
|
|
|
|
| 96 |
48.5 |
54.4 |
59.4 |
81 |
110 |
121 |
167 |
77 |
85 |
7.325261x |
1.3616 |
5.7321 |
5.99 |
NS |
S = Significant; NS = Not Significant.
Table 3: Acute toxicity test results of (Mercury) + Cadmium to L.rohita.
| |
|
95% Fiducial limits of LC50 (ppm) |
Probit regression equation |
|
|
| |
Lethal concentration (ppm) |
Slope |
Chi-square values |
| |
|
|
|
| Hours |
|
|
|
|
|
|
|
|
|
|
|
|
|
Level of |
| |
LC5 |
|
|
|
|
|
|
Lower |
Upper |
Y = a+b x |
“S” |
Observed |
Table |
significance at |
| |
|
LC10 |
LC16 |
LC50 |
LC84 |
LC90 |
LC99 |
|
|
|
|
|
|
0.05 level |
| |
|
|
|
|
|
|
|
|
|
Y=-26.35913 + |
|
|
|
|
| 24 |
49.2 |
51.5 |
53.4 |
60.4 |
68.3 |
70.8 |
80.6 |
57.5 |
63.5 |
17.57739X |
1.13128 |
12.5379 |
11.07 |
S |
| |
|
|
|
|
|
|
|
|
|
Y=-20.51776 + |
|
|
|
|
| 48 |
43.3 |
48.9 |
48 |
56.1 |
65.6 |
68.6 |
80.8 |
55.2 |
57 |
14.59043X |
1.1688 |
7.18575 |
12.59 |
NS |
| |
|
|
|
|
|
|
|
|
|
Y=-13.66395 + |
|
|
|
|
| 72 |
37 |
40.1 |
42.8 |
53.2 |
66.2 |
70.6 |
88.8 |
50.6 |
56 |
10.81501X |
1.2447 |
24.4533 |
12.39 |
S |
| |
|
|
|
|
|
|
|
|
|
Y=-20.16803 + |
|
|
|
|
| 96 |
38.5 |
40.9 |
42.8 |
50.2 |
58.9 |
61.6 |
72.9 |
49.1 |
51.2 |
14.79845X |
1.17294 |
9.50832 |
12.59 |
NS |
S = Significant; NS = Not Significant.
Table 4: Acute toxicity test results of (Cadmium) + Mercury to L.rohita.
| |
|
95% Fiducial limit of |
Probit regression equation |
Slope |
|
| |
Lethal concentration (ppm) |
LC50 (ppm) |
Chi-square values |
| |
|
|
Function |
|
| Hours |
|
|
|
|
|
|
|
|
|
|
|
|
|
Level of |
| |
LC5 |
|
|
|
|
|
|
Lower |
Upper |
Y = a+b x |
“S” |
Observed |
Table |
significance at |
| |
|
LC10 |
LC16 |
LC50 |
LC84 |
LC90 |
LC99 |
|
|
|
|
|
|
0.05 level |
| |
|
|
|
|
|
|
|
|
|
Y=11.4719 + |
|
|
|
|
| 24 |
0.21 |
0.22 |
0.24 |
0.28 |
0.34 |
0.36 |
0.43 |
0.27 |
0.3 |
11.81938X |
1.19956 |
21.9616 |
11.07 |
S |
| |
|
|
|
|
|
|
|
|
|
Y=10.0244 + |
|
|
|
|
| 48 |
0.18 |
0.2 |
0.21 |
0.27 |
0.34 |
0.37 |
0.47 |
0.25 |
0.29 |
8.907909X |
1.26542 |
18.2988 |
11.07 |
S |
| |
|
|
|
|
|
|
|
|
|
Y=8.112757 + |
|
|
|
|
| 72 |
0.13 |
0.16 |
0.18 |
0.27 |
0.4 |
0.45 |
0.7 |
0.25 |
0.28 |
5.406702X |
1.51346 |
11.9673 |
12.59 |
NS |
| |
|
|
|
|
|
|
|
|
|
Y=7.387148 + |
|
|
|
|
| 96 |
0.11 |
0.12 |
0.14 |
0.25 |
0.45 |
0.53 |
0.96 |
0.24 |
0.26 |
3.962734X |
1.78123 |
6.52691 |
12.59 |
NS |
S = Significant; NS = Not Significant.
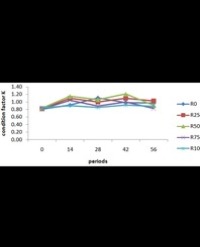
In the metal mixture (HgCl2) + CdCl2 , no mortality was observed in (0.064 ppm of HgCl2) + 48 ppm CdCl2 within 24 hours (Table 3) while 100% mortality was noticed in (0.064 ppm of HgCl2) + 64 ppm of CdCl2 after 24 hours. The LC50 values for 24, 48, 72 and 96 hours were 60.4, 56.1, 53.2 and 50.2 ppm respectively (Table 3). In the second metal mixture (CdCl2) + HgCl2 , no mortality was observed in (8.096 ppm of CdCl2) + 0.18 ppm of HgCl2 after 24 hours (Table 4). But 100% mortality was noticed in (8.096 ppm of CdCl2) + 0.32 ppm of HgCl2 after 24 hours. The LC50 values for 24, 48, 72 and 96 hours were 0.28, 0.27, 0.27 and 0.25 ppm (Table 4). In the above four experiments, the LC50 values observed decreased with the increase in the duration of exposure (Figure 1).

Figure 1: LC50 values of Labeo rohita exposed to mercury, cadmium and their combinations.
Discussion
The present study reveals that mercury, cadmium and their mixtures are toxic to the fish, L. rohita and mortality rate increased with increasing concentrations of metals. The mortality rate depends upon the duration of exposure. The LC50 values for mercury, cadmium and two types of mixtures (in one type mercury was kept constant and cadmium concentrations varied and in the second type, cadmium was kept constant and mercury concentrations varied) for 96 hours were 0.64, 81, 50.2 and 0.25 ppm respectively.
The LC50 value of mercury for 96 hours is about three times lesser than that of Ophiocephalus (Channa) punctatus [22]. The LC50 value of cadmium for 96 hours is about six times higher than that of Oreochromis niloticus [23], about three times higher than that of Poecilia reticulata and for Catla catla it was very low [24].
LC50 value of zinc for 96 hours to L. rohita was found to be 156ppm [25]. The toxicity of hexavalent chromium has been studied in L. rohita [26] and its 96 hours LC50 value was 111.45 mg/l. The 96 hours LC50 values of copper to Tilapia guineensis and Tympanotonus fuscatus were 0.16 and 8.84 mg/l respectively [27]. The above findings indicate that the range of toxicity varied for different species and for different toxicants. Furthermore, several factors like pH, hardness, alkalinity, equilibration and kinetics involved in the chemical reactions are detrimental in the toxic efficacy.
One of the recent areas of research in toxicology is concerned with the fate of toxicants inside the organisms. The toxicant uptake by aquatic organisms is a two phased process, which involves initial rapid adsorption or binding to surface, followed by a slower transport into the cell interior. The transport of metal into the intracellular compartment may be facilitated by either diffusion of the metal across the cell membrane or by active transport by carrier protein [28]. The metal enters the blood circulation of fish and finds its way into different tissues of the body where it affects normal metabolism. Generally, liver is the centre of metabolism and detoxification in piscine body [29]. The kidney plays a major role in the accumulation, detoxification and excretion of metals and is considered to be a target organ for metal toxicity [30,31].
Exposure to toxic heavy metals is associated with many chronic diseases. Recent research found that low levels of lead, mercury, cadmium, aluminium and arsenic can cause a variety of health problems like decreased intelligence in children, nervous symptoms, immune dysfunctions, depression, fatigue, anemia, skin rashes, high BP, memory loss, diarrhea, nausea, irritability, tremors, cancer, hyperactivity, autism, behavioural disorders and head-ache [32,33].
The toxicity of mercuric chloride, cadmium chloride and their mixture to N.notopterus was determined by 96 hours LC50 concentration which indicated that CdCl2 was less toxic, while HgCl2 was most highly toxic and their mixture were in between them [34]. Consequently, in terms of ecological significance, fish are irreplaceable bio-indicators of the degree of damage to the water environment. Moreover, it is also important to monitor the contamination of fish with heavy metals, because frequent consumption of the contaminated fish presents a very serious health risk [35].
Conclusion
Among the two metals tested mercury exhibited higher toxicity than that of cadmium. Both the mixtures exhibited their LC50 values in between the LC50 values of cadmium and mercury to the Indian major carp, L.rohita.
Acknowledgement
The authors thank the authorities of the American College, Madurai, Tamil Nadu, India for the facilities and encouragement.
References
1. Patil GP, Dhanda RR. Effects of HgCl2 and CdCl2 on haemato biochemical parameters of fresh water fish Channa punctatus (Bloch). J Ecotoxicol Environment Monit. 2000; 10: 177-181.
2. Shin HW, Sidharthan M, Young KS. Forest fire ash heavy metal, cadmium impact on two representatives of micro and macro algae of the receiving water of the east coast of South Korea. Mar Poll Bull. 2002; 45: 203-209.
3. Shukla V, Dhankhar M, Jaiprakash C, Sastry KV. Bio-accumulation of Zn, Cu and Cd in Channa punctatus. J Environ Biol. 2007; 28: 395-397.
4. Rajendran P, Muthukrishnan J, Gunasekaran P. Microbes in heavy metal remediation. Ind J Exp Biol. 2003; 41: 935-944.
5. Sarkar S, Gupta A. Treatment of chrome plating waste water by using activated alumina. Ind J Environ Hlth. 2003. 45: 73-82.
6. Shukla OP, Rai UN, Singh NK, Dubey S, Baghel VS. Isolation and characterization of chromate resistant bacteria from tannery effluent. J Environ Biol. 2007; 28: 399-403.
7. Sivaperumal P, Sankar TV, Nair PGV. Heavy metal concentrations in fish, shellfish and fish products from internal markets of India vis-a-vis international standards. Food Chem. 2007; 102: 612-620.
8. Kelderman P, Drossaert WME, Min Z, Galione LS, Okontwo LC, Clarisse IA. Pollution assessment of the canal sediments in the city of Delft (The Netherlands) Wat Res. 2000; 34: 936-944.
9. Tilak KS, Veeraiah K, Rao DK. Biochemical changes induced by chloropyrifos, an organophosphate compound in sublethal concentration to the fresh water f ish Catla catla, Labeo rohita and Cirrhinus mrigala. J Environ Biol. 2005; 26: 341-347.
10. Suciu I, Cosma C, Todica M, Bolboaca SD, Jantschi L. Analysis of soil heavy metal pollution and pattern in central Transylvania. Int J Mol Sci. 2008; 9: 434-453.
11. Suziki KT, Sunaga H, Aoki Y, Hatakayama S, Sumi Y, Suziki T. Binding of cadmium and copper in the mayfly Baetis themicus larvae that inhabit in a river polluted with heavy metals. Comp Biochem Physiol. 1988; 91: 487-492.
12. Kalay M, Canli M. Estimation of essential (Cu and Zn) and non essential (Cd and Pb) metals from tissues of fresh water fish Tilapia zilli. Tr J Zool. 2000; 24: 429-436.
13. Karr JR. Assessment of biotic integrity using fish communities. Fisheries. 1989; 6: 21-27.
14. Yilmaz AB. Levels of heavy metals (Fe, Cu, Ni, Cr, Pb and Zn) in tissues of Mugil cephalus and Trachurus mediterraneus from Iskendeurn Bay, Turkey. Environ Res. 2003. 92: 277-281.
15. Allen P. Chornic accumulation of cadmium in the edible tissues of Oreochromis mossambicus : modification by mercury and lead. Arch Environ Contam Toxicol. 1995; 29: 8-14.
16. Colombo JC, Bilos C, Lenicov RM, Colautti D, Landoni P, Brochy C. Detritivorous fish contamination in the Rio de la plata estuary: a critical accumulation pathway in the cycle of anthropogenic compounds. Can J Fish Aquat Sci. 2000; 57: 1139-1150.
17. Sunlu V, Egemen O, Basaran Z. The red mullet Muslus barbatus L. as an indicator for heavy metal pollution in Izmir bay (Turkey) 36th CIESM Congress Proceedings, Monte-Cario Monaco, 2001; 36: 166.
18. Canli M, Atli G. The relationship between heavy metals Cd, Cr, Cu, Fe, Pb, Zn) levels and size of six Mediterranean fish species. Environ Pollut. 2003. 121: 129-136.
19. Lwanga MS, Kansiime F, Denny P and Scullion J. Heavy metals in lake George, Uganda, with relation to metal concentrations, in tissues of common f ish species. Hydrobiologia. 2003; 499: 83-93.
20. Omkar A. Concepts of toxicology, Shoban lal Nagin Chand Co, Ltd, Jalandhar, 1994; 1-30.
21. Finney DJ. Probit analysis, Cambridge University Press, London. 1964; 20-47.
22. Sastry KV, Sharma K. Mercury induced haematological and bio-chemicals anomalies in Ophiocephalus (channa) punctatus. Toxicol Lett. 1980; 5: 245 249.
23. Garcia-Santos S, Fountainhas-Fernandes A, Wilson JM. Cadmium tolerance in the Nile tilapia Oreochromis niloticus following acute exposure, assessment of some iono regulatory parameters. Environ Toxicol. 2006; 121: 33-46.
24. Yilmaz M, Gill A, Karakose E. Investigation of acute toxicity and the effect of cadmium chloride (CdCl2 . H2O) metal salt on behaviour of the guppy Poecilia reticulata. Chemospere. 2004; 56: 375-380.
25. Loganathan K, Velmurugan B, Hongray HJ, Selvanayagam M, Bhusan PB. Zinc induced histological changes in brain and liver of Labeo rohita (Ham). J Environ Biol. 2006; 27: 107-110.
26. Vutukuru SS. Acute effects of hexavalent chromium on survival, oxygen consumption, haematological parameters and some biochemical profiles of Indian major carp, Labeo rohita. Int J Environ Res Public Health. 2005; 2: 456-462.
27. Oyewo EO, Don-Pedro KN. The toxicity ranking of four heavy metals of industrial source to six resident animals of a tropical estuarine lagoon. Toxicol Envrion Chem. 2002; 83: 87-97.
28. Brezonik PL, King SO, Mach CE. The influence of water chemistry on trace metal bioavailability and toxicity to aquatic organisms. In: Metal ecotoxicology concepts and applications (Eds: M.C.Newman and A.W.Mdntose) Lewis Publishers Inc. Michigan 1991; 1-26.
29. Athikesavan S, Vincent S, Ambrose T, Velmurugan B. Nickel induced histopathological changes in the different tissues of freshwater fish Hypophthalmichthy molitrix (Valenciennzes). J Environ Biol. 2006. 27: 391-395.
30. WHO. Nickel environmental health criteria, 108 World health organization, Finland. 1991; 101-117.
31. Eisler R. Nickel hazards to fish, wildlife and invertebrates: a syno review. V.S.Geological survey, Biological resources division, Biological science report USGS/BRD/BSR-1998-2001.
32. Herawati N, Susuki S, Hayashi K, Rivai IF, Koyama M. Cadmium, copper and zinc levels in rice and soil of Japan, Indonesia and China by soil type. Bull Environ Contam Toxicol. 2000. 64: 33-39.
33. Bandouin C, Charveson M, Tarrouse R, Gall Y. Environmental pollutants and skin cancer. Cell Biol Toxicol. 2002. 18: 341-348.
34. Sindhe VR, Kulkarni RS. Gonadosomatic and heptosomatic indices of fresh water fish Notopterus notopterus (Pallas) in response to some heavy metal exposure. J Environ Bio. 2004; 25: 365-368.
35. Agtas S, Gey H, Gul S. Concentration of heavymetals in water and chub, Leuciscus cephalus (Linn) from the river Yildiz, Turkey. J Environ Biol. 2007. 28: 845-849.