Research Article
A Cellular Fluorescence Assessment Technique Applying to Quantitate the Sweetness Degree
Jun Weng1#, Xi Qin1#, Yangjin Zhu1, Xing Chen2, Wei Chen2, Li Su1*, and Keliang Yan2*
1Key Laboratory of Molecular Biophysics of Ministry of Education, Huazhong University of Science and Technology, China
2Technology Center of China Tobacco, Yunnan Industrial Co., Ltd, China
#Jun Weng and Xi Qin contributed equally to this study as co-first authors
*Corresponding author: Li Su, Key Laboratory of Molecular Biophysics of Ministry of Education, College of Life Science and Technology, Huazhong
University of Science and Technology, Wuhan, 430074 China, Tel: 86-27-87792024; Fax: 86-27-87792072; Email:
lisu@hust.edu.cn
Submitted: 18 March 2019; Accepted: 17 April 2019; Published: 22 April 2019
Cite this article: Weng J, Qin X, Zhu Y, Chen X, Chen W, et al. (2019) A Cellular
Fluorescence Assessment Technique Applying to Quantitate the Sweetness Degree. JSM Analytic Bioanalytic Techniq 3: 6.
Taste variations distinguishable by human taste buds are
categorized into five major modalities; sour, sweet, bitter, umami
and salty [1]. Each taste modality is mediated by a unique receptor
expressed on the membrane of the taste bud cells (TBCs). Earlier
reports suggest that different classes of TBCs, which express one
taste receptor, can exclusively respond to distinct ligand stimuli
with differential signal pathway [2-4]. The taste receptors that
recognize sweet and umami are evidently encoded by T1R1,
T1R2 and T1R3. Human T1R2 and T1R3 act jointly to form a
heterogenic dimer, which serves as the sweet taste receptor.
Human T1R1 and T1R3 also function as heterogenic dimers for
the umami receptor [5].
T1Rs taste receptors originate from the C-family of G-proteincoupled
receptor, which has an extracellular N-terminal, sevenhelical-
transmembrane domains, three extracellular loops,
three intracellular loops and an intracellular carboxyl tail [6].
The seven helical transmembrane domains are closely linked to the N-terminal flytrap domain via a cysteine-rich structural
domain [6]. As the primary receptors for diverse sweet ligands,
T1R2/T1R3 can respond to sweet molecules and activate two
different signaling pathways depending on the property of
the ligands, natural sugar, or artificial sweetener. T1R2/T1R3
receptor activates the downstream Gα protein, cAMP, cNMPgated
channels, Ca2+ influx, and PKA orderly, important for
phosphorylation of basolateral K+ channels, thereby shutting off
basolateral K+ channels when natural sugars bound to it. This
ultimately depolarizes cell membranes and the voltage-dependent
influx of Ca2+ [7,8]. Again, binding of artificial sweetener to the
T1R2/T1R3 receptor activates other signal pathways through
the downstream Gα and GβGγ protein to produce IP3 (which
binds to IP3 receptor on the ER) and culminates in the release
of Ca2+ from ER into the cytoplasm. The increase of cytoplasmic
Ca2+ concentration facilitates release of neurotransmitters, with
consequent sweet perceptions [9,10].
Sweetness is usually assessed by sucrose reference solutions
comparison. Thus, sucrose is used as a standard sweet substance
to which all other sweeteners are compared. Several sweetness
measurement methods have been developed; however, most
of them lack a physiological degree value. In this study, we
constructed and screened a cell line derived from HEK293 that
stably expresses sweet taste receptors T1R2/T1R3 to simulate
the human sweet taste receptor’s perception, and to establish a
credible method to evaluate the sweetness degree in physiological
environment.
Plasmids and cell lines
The cDNA sequences of human T1R2 and T1R3 were synthesized
by the Wuhan Qingke company. Specific primers used for
amplifying T1R2 cDNA were T1R2-F (FW: 5’-AAGCTTGCCACCATGGGGCATCATCATCATCATCATGGATCCATGGGGCCCAGGGCAAAGACC-
3’) and T1R2 (RV: CCGCTCGAGCTAGTCCCTCCTCATGGTGTAGC).
T1R2-F contained HindIII, 6×His tag coding sequence and
BamHI sites. T1R2-R contained a translation terminator and XhoI
site. The His-T1R2 gene sequence was ligated into the pcDNA3
vector to construct a recombinant plasmid (pcDNA3-His-T1R2).
Specific primers used for amplifying T1R3 cDNA were T1R3-F
(FW: 5’-CCCAAGCTTGGTACCGACATGGACTACAAGGACGACGATGACAAGGGATCCATGCTGGGCCCTGCTGT-
3’) and T1R3-R (RV:
5’-CCGCTCGAGTCACTCATGTTTCCCCTGAT-3’). T1R3-F contained
HindIII, Flag tag coding seqence and BamHI sites before the initiation
codon. T1R3-R contained a translation terminator and XhoI.
The Flag-T1R3 gene sequence was ligated into the pcDNA3 vector
to construct a recombinant plasmid (pcDNA3-Flag-T1R33).
The plasmids pcDNA3-His-T1R2 and pcDNA3-Flag-T1R3
were co-transfected into HEK293 cells (CCTCC, Wuhan, China).
The cells were cultured in RPMI-1640 complete medium containing
10 % FBS (Everyday Green, China), and screened with 600
μg/ml G418 (Thermo) for two weeks and then with 300 μg/ml
G418 for three weeks. The surviving cells were dispersed and
diluted into 96-well plates for monoclonal cell screening and expansion.
Western blot
Cells were split with RIPA lysate buffer and whole proteins
in cells were collected for Western blotting. 8 % SDS-PAGE gel
was used for electrophoresis to separate proteins. The proteins
in SDS-PAGE gel were transferred to a nitrocellulose membrane.
After blocking with 5% BSA, the membranes were incubated with
antibodies against T1R2, T1R3 and actin (Abcam, Wuhan, China).
The membranes were incubated with the diluted HRP conjugated
secondary antibodies (Abcam) for 2 hours, and then exposed to
autoradiographic film with ECL (Thermo) in a dark room.
Immunofluorescence detection
Sterling 10 mm coverslips were incubated with polylysine at
37°C for 30 min and washed with PBS thrice, and placed in 35
mm dishes. The expanded monoclonal cells were plated in the
dishes in proportion to abundance of 50 - 70 %. After culturing
for 24 hours, the cells were treated with 4 % paraformaldehyde
for 15 min, and then washed with PBS buffer thrice. After blocking
with 5 % BSA (Sigma) for 30 min, the cells were incubated
overnight with T1R2/T1R3 antibodies at 4 °C and washed with
PBS buffer thrice for 5 min each. These were then incubated with
diluted FITC/TRITC secondary antibodies (Abcom) for 30 min at
room temperature. Finally, the cells were washed with PBS buffer
thrice for 5 min and detected using a FV1000 laser confocal
microscope (Olympus, Japan).
Detection of intracellular Ca2+ concentration with FV1000 confocal microscopy
Cells were planted in the confocal dish with an outer and inner
diameter of 35 and 10 mm, respectively in abundance of 40-
60 %. Following 24 hours culturing, the cells were stained with
Fluo-4 AM (Beyotime) for 30-45 mins in 37 °C, and then washed
once with PBS. The cells were imaged with a FV1000 confocal laser scanning microscope according to the setting: 60 × oil mirror
as objective lens, helium ion laser as laser source, 488 nm excitation
wavelength, 500-600 nm emission wavelength range, 8μs/
Pixel scanning speed, 640 x 640-pixel scanning area, and noninvasive
XYT scanning procedure applied to the cells. Continuous
image scanning was recorded and at room temperature under
dark conditions for 2 min. Total number of image frames was 60
and exogenous stimulus solution was added after 12 seconds.
Glucose (Sigma) and sucrose (Sigma) were used to prepare exogenous
stimulus solutions.
Image analysis
The images were analyzed with ImageJ software (National Institutes
of Health, USA) and data were plotted and analyzed with
GraphPad 7.0 Prism (GraphPad Software, San Diego, CA). Images
of intracellular Ca2+ were collected and analyzed with ImageJ, and
data were plotted as columns or scatter diagrams with GraphPad Prism.
Data analyses
Data were presented as mean ± SD of three independent replicates
(triplicates). A t-test was used to compare the difference
between groups, and values of P < 0.05 were considered statistically
significant, unless otherwise specified.
Characteristics of HEK293-T1R2/T1R3 cell line
To obtain a stable cell line which expresses human sweet
taste receptor T1R2/T1R3, we first constructed plasmids, pcDNA3-
His-T1R2 and pcDNA3-Flag-T1R3, to express recombinant
T1R2andT1R3, respectively. Both plasmids were co-transferred
into HEK293 cells by electroporation transfection technique and
monoclonal cells were screened by G418 for five weeks and then
expanded for following experiment. (Figure 1(a)). To identify
whether sweet receptors are expressed in selected monoclonal
cells and their localization in monoclonal cells, we performed
western blotting with specific antibodies against T1R2andT1R3,
and identified the sweet taste receptor localization in monoclonal
cells by immunofluorescence imaging. The results showed that
the cells screened out could stably express the sweet taste receptor
proteins T1R2 (94 kDa) and T1R3 (96 kDa) (Figure 1(b)), and
the receptors are located on the cell membrane (Figure 1(c)). We
named the verified monoclonal cell as T1R2/3H cell.
-
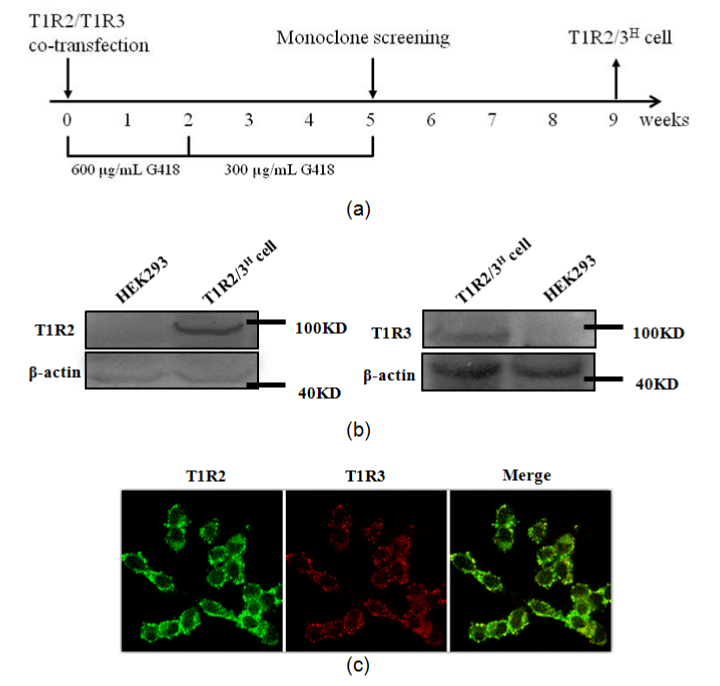 Figure 1:Construction of the cell line stable expressing human T1R2/T1R3. (a) The schematic chart of screening procedures. HEK293 cells were
co-transfected with pcDNA-His-T1R2 and pcDNA-Flag-T1R3, then treated with 600 μg/ml G418 in the first two weeks, and with 300 μg/ml G418
during the third to fifth weeks. T1R2/3H cell indicates the monoclonal cell stable expressing T1R2 and T1R3. (b) Identification of T1R2 and T1R3
expressed in screened cell line by western blot. β-actin served as a reference. (c) Cellular localization of T1R2 and T1R3 expressed in screened
monoclonal cell line. T1R2 was detected with specific T1R2-antibody and FITC secondary antibody, while T1R3 was detected with T1R3-antibody
and TRITC secondary antibody. View Figure
Detection of T1R2/3H cell responding to sucrose
Activated sweet taste receptors could lead to increase of
Ca2+ concentration in the cytoplasm (Figure 2(a)). To determine
whether sweet taste receptors stably expressed in T1R2/3H cell
can respond to sweet molecules, we chose 150mM sucrose solution
as exogenous stimulus and detect the variation of intracellular
calcium concentration with fluorescence probe Fluo-4
AM. Fluorescence emission from Fluo-4 AM was detected, and
fluorescence images were recorded every 4s for 2 min under
confocal scanning microscope with exogenous stimulation (Supplementary
file 1 for T1R2/3H cells and Supplementary file 2
for HEK293 cells). It was clearly observed that the fluorescence intensity in both T1R2/3H cells and HEK293 cells increased expressly
responding to sucrose solution (Figure 2(b)), indicating
the increase of intracellular Ca2+ concentration. However, the variation
of Fluo-4 AM fluorescence intensity in T1R2/3H cells was
more significant than that in HEK293 cells. This indicates that the
sweet receptors stable expressed in T1R2/3H cells can respond
to sucrose solution, contributing to the increasing of Ca2+ related
fluorescence.
-
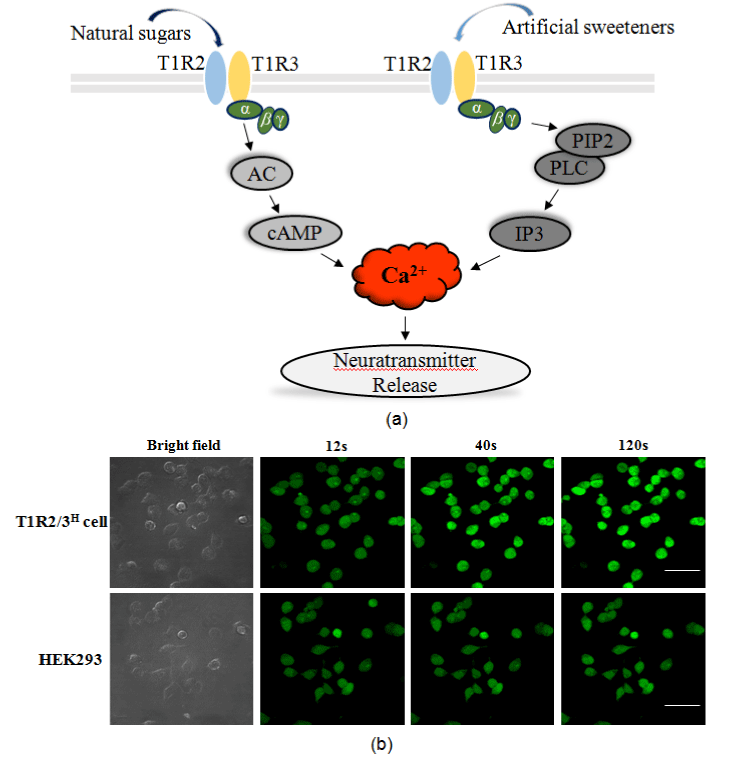 Figure 2:Sweet taste receptors expressed on cells can respond to sucrose. (a) The schematic pathways of Ca2+ release triggered by T1R2/T1R3
responding to natural sugars and artificial sweeteners. (b) Fluorescent and bright field image at different time spots (12s, 40s, 120s) with 150mM
sucrose stimulation. The fluorescence images probing intracellular Ca2+ in T1R2/3H cell and HEK293 were captured every 4s within 2 mins by
confocal microscope, and sucrose solution was added at 12s after the scan beginning (scale bar = 50 μm). View Figure
Establishing a method for quantifying intracellular Ca2+ concentration based on fluorescence intensity
To further quantify the difference between the T1R2/3H cell
and HEK293 response to sweet molecules, we calculated the fluorescence
intensity of single cells obtained from fluorescence images.
The image stacks showing representative single cells from
two cell lines at separate time spots of are shown in Figure 3(a).
The fluorescence intensity of each cell was calculated by ImageJ
software and plotted against time (Figure 3(b)). After sucrose treatment, the cellular fluorescence intensity of T1R2/3H cells increased
significantly, while that of HEK293 cells had no distinct
changes, reaffirming that the sweet receptors stable expressed in
T1R2/3H cells can respond to sucrose. We further calculated the
ratio of single-cell fluorescence increasement (ΔF/Fo), defined as
ΔF/Fo = (Fmax-Fo)/Fo. Fo is the average of three weakest fluorescence
intensities of the cells in the first 20s, and Fmax is the
maximum fluorescence intensity value in the first 120s. Six representative
single cells were selected from each group for ΔF/Fo
calculation. The average ΔF/Fo value of T1R2/3H cell was 0.62,
while that of HEK293 was as low as 0.14. The D-value of ΔF/Fo
between T1R2/3H cell and HEK293 is 0.48, which represents the
activation of receptors by sucrose treatment (Figure 3(c)).
-
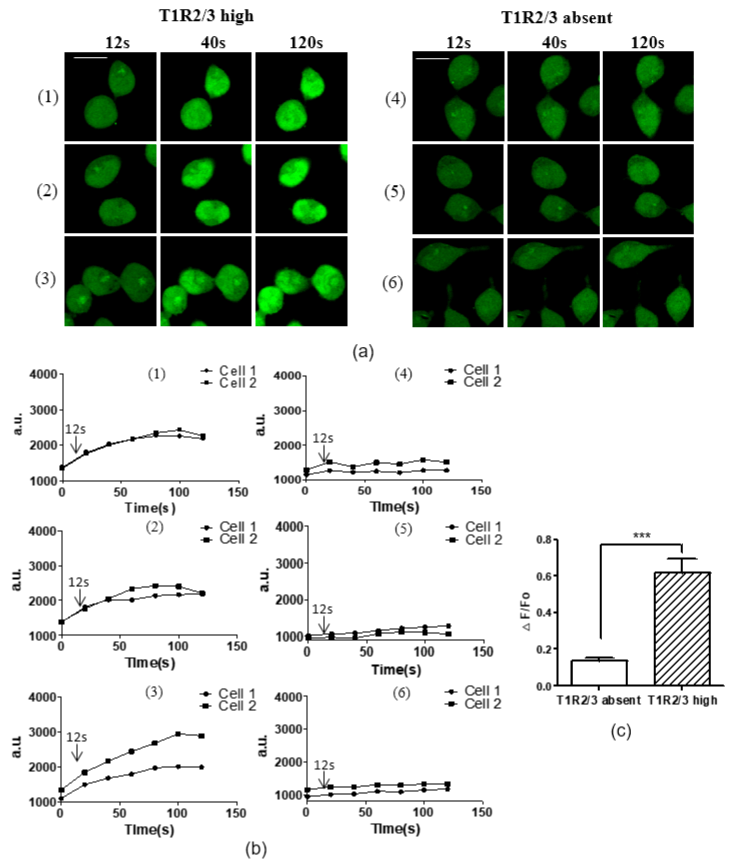 Figure 3:Quantitation of intracellular Ca2+ concentration based on fluorescence intensity. (a) the fluorescent images showing several representive
cells in two cell lines at 12s, 40s, and 120s time points. T1R2/3 high represents T1R2/3H cell, and T1R2/3 absent represents HEK293 (scale bar =
20 μm). (b) The cellular fluorescence intensity of each fluorescence image showing in (a). Curves were plotted against time within 2 mins. Sucrose
solution was added into cell medium at 12s. (c) ΔF/Fo of HEK 293 (as T1R2/3 absent) and T1R2/3H cell (as T1R2/3 high) with 150 mM sucrose
treatment. (n=6, three independent experiments, p=0.0001, two-tailed Student’s t-test.) View Figure
Fitting the standard curve of D-value of ΔF/Fo related
to concentration of sucrose
To determine how sweet taste receptors in T1R2/3H cells
could respond to sucrose at different concentrations, the fluorescence images of two cell lines were obtained with sucrose
treatment at series of concentrations. The results also showed
that increased fluorescence intensity and F/Fo of T1R2/3H cells
were higher than that of HEK293 cells studied (Figures 4(a) and
4(b)). Furthermore, we found that the D-value of ΔF/Fo between
T1R2/3H cell and HEK293 is linearly dependent on the sucrose
concentration within 50-250 mM, expressed as regression equation
Y= 0.001945 X-0.01064 (R32=0.9886) (Figure 4(c)). The Rsquared
value of 0.9886 suggests that the linear regression equation
is successful when sucrose concentraion changes within 50
to 250 mM, which can be employed to quantitatively sweetness
measurement.
-
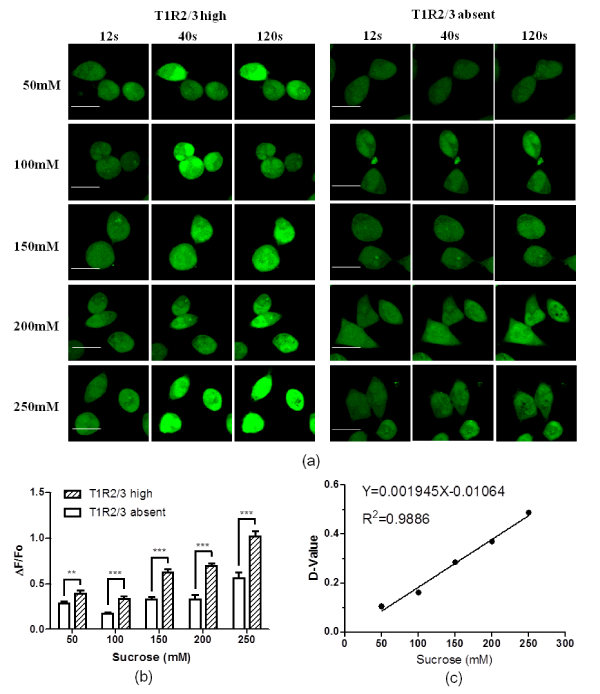 Figure 4:Fitting the standard curve of D-value of ΔF/Fo related to sucrose of different concentrations. (a) Fluorescence images probing cellular Ca2+
of two cell lines with sucrose treatments at different concentration. T1R2/3 high represents T1R2/3H cell, and T1R2/3 absent represents HEK293
(scale bar = 20 μm). (b) ΔF/Fo of two cell lines with different sucrose treatments (n>=20, three independent experiments, p=0.0054 (50mM) and
p<0.0001 (100mM to 250mM), two-tailed Student’s t-test.). (c) The correlation between D-value of ΔF/Fo and sucrose concentration (from 50mM
to 250mM) was fit to linear dependence (R2=0.9886). View Figure
Measuring the relative sweetness degree of glucose
In order to applying our cellular fluorescence assessment
technique to measure the relative sweetness of glucose, we prepared
200 mM glucose solution as a sample for sweetness measuring
and set 200mM sucrose solution as the standard sweetness solution. Fluo-4 AM fluorescence images were recorded under
confocal scanning microscope with glucose solution stimulation
(Figure 5). The D-value of ΔF/Fo is 0.27 for 200mM glucose. According
to the regression equation we got above, equal sucrose
concentration of 200mM glucose is calculated as 144mM, and the
relative sweetness of glucose is 0.72 (144mM/200mM), which is
similar to 0.74, the value of reported relative sweetness of glucose [11].
-
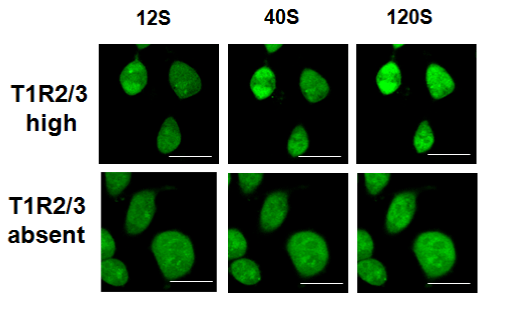 Figure 5:The fluorescent images showing several representive cells
in T1R2/3H cells and HEK293 cells at 12s, 40s, and 120s time points.
200mM glucose solution was added into cell medium at 12s. T1R2/3
high represents T1R2/3H cell, and T1R2/3 absent represents HEK293
(scale bar = 20 μm). View Figure
Currently, sweetness detection is restricted to detecting content
of sweet substances through physical or biological methods.
However, these methods have limitations. For example, liquid
chromatography techniques can accurately detect the content
of sweet substances, but it can only detect known sweet substances
with known sweetness degree and are unable to identify
unknown sweet substances. Moreover, simply converting, and
overlaying values of sweetness degree of each sweet substance may not reflect the real sweetness of a mixture. Training professionals
primarily do bioassay testing to quantify sweetness by
tasting sweet substances. This method can reflect the sweetness
of sweet complexes at the physiological level and can also assess
the sweetness of unknown sweet complexes or pure products,
but the testing platform is highly unpredictable and less accurate.
In this study, we screened out a cell line derived from HEK293
which stably expresses human sweet taste receptors on the cell
membrane. The cell line could respond to sweet molecules such
as sucrose, which is usually regarded as a standard reference for
sweetness measurement (orosensory perception measurement)
[12]. In T1R2/3H cell, sucrose could bind to T1R2/T1R3 receptors
expressed on cellular membrane, and then activate the intracellular
pathways, leading to higher Ca2+ concentration, which could
be visualized by fluorescence probe Fluo-4 AM. D-value of ΔF/Fo
calculated from the cellular fluorescence intensity could specifically
reflect the activation degree of sweet taste receptors, which
directly corresponds to the concentration and sweetness of ligands.
D-value of ΔF/Fo between T1R2/3H cells and HEK293 cells
was linearly contingent on sucrose concentration (50-250mM).
Our method may be employed to evaluate concentration of sucrose
solution, and other sweeteners. This prototype developed
is based on a physiological system to measure the sweetness degree
of samples, which could be potentially useful in industrial
food and drug applications.
In this study, we constructed the cells with stably highexpression
of T1R2 and T1R3, and then established a credible
method to quantify the sweetness degree using the variation of fluorescence intensity reflecting cytoplasmic Ca2+ concentration.
This method is promising for sweet taste sensory application detection.
This work was supported by the National Key Research
and Development Program of China (2017YFD0400301) and
the Research Foundation of Yunnan Tobacco Industry Co. Ltd
(110201402042), Yunnan Province, PR. China. The authors thank
the technical support from the central facilities at School of Life
Science and Technology, Huazhong University of Science and
Technology, Wuhan, Hubei Province, PR. China.
 Figure 1:Construction of the cell line stable expressing human T1R2/T1R3. (a) The schematic chart of screening procedures. HEK293 cells were
co-transfected with pcDNA-His-T1R2 and pcDNA-Flag-T1R3, then treated with 600 μg/ml G418 in the first two weeks, and with 300 μg/ml G418
during the third to fifth weeks. T1R2/3H cell indicates the monoclonal cell stable expressing T1R2 and T1R3. (b) Identification of T1R2 and T1R3
expressed in screened cell line by western blot. β-actin served as a reference. (c) Cellular localization of T1R2 and T1R3 expressed in screened
monoclonal cell line. T1R2 was detected with specific T1R2-antibody and FITC secondary antibody, while T1R3 was detected with T1R3-antibody
and TRITC secondary antibody. View Figure
 Figure 2:Sweet taste receptors expressed on cells can respond to sucrose. (a) The schematic pathways of Ca2+ release triggered by T1R2/T1R3
responding to natural sugars and artificial sweeteners. (b) Fluorescent and bright field image at different time spots (12s, 40s, 120s) with 150mM
sucrose stimulation. The fluorescence images probing intracellular Ca2+ in T1R2/3H cell and HEK293 were captured every 4s within 2 mins by
confocal microscope, and sucrose solution was added at 12s after the scan beginning (scale bar = 50 μm). View Figure
 Figure 3:Quantitation of intracellular Ca2+ concentration based on fluorescence intensity. (a) the fluorescent images showing several representive
cells in two cell lines at 12s, 40s, and 120s time points. T1R2/3 high represents T1R2/3H cell, and T1R2/3 absent represents HEK293 (scale bar =
20 μm). (b) The cellular fluorescence intensity of each fluorescence image showing in (a). Curves were plotted against time within 2 mins. Sucrose
solution was added into cell medium at 12s. (c) ΔF/Fo of HEK 293 (as T1R2/3 absent) and T1R2/3H cell (as T1R2/3 high) with 150 mM sucrose
treatment. (n=6, three independent experiments, p=0.0001, two-tailed Student’s t-test.) View Figure
 Figure 4:Fitting the standard curve of D-value of ΔF/Fo related to sucrose of different concentrations. (a) Fluorescence images probing cellular Ca2+
of two cell lines with sucrose treatments at different concentration. T1R2/3 high represents T1R2/3H cell, and T1R2/3 absent represents HEK293
(scale bar = 20 μm). (b) ΔF/Fo of two cell lines with different sucrose treatments (n>=20, three independent experiments, p=0.0054 (50mM) and
p<0.0001 (100mM to 250mM), two-tailed Student’s t-test.). (c) The correlation between D-value of ΔF/Fo and sucrose concentration (from 50mM
to 250mM) was fit to linear dependence (R2=0.9886). View Figure
 Figure 5:The fluorescent images showing several representive cells
in T1R2/3H cells and HEK293 cells at 12s, 40s, and 120s time points.
200mM glucose solution was added into cell medium at 12s. T1R2/3
high represents T1R2/3H cell, and T1R2/3 absent represents HEK293
(scale bar = 20 μm). View Figure


